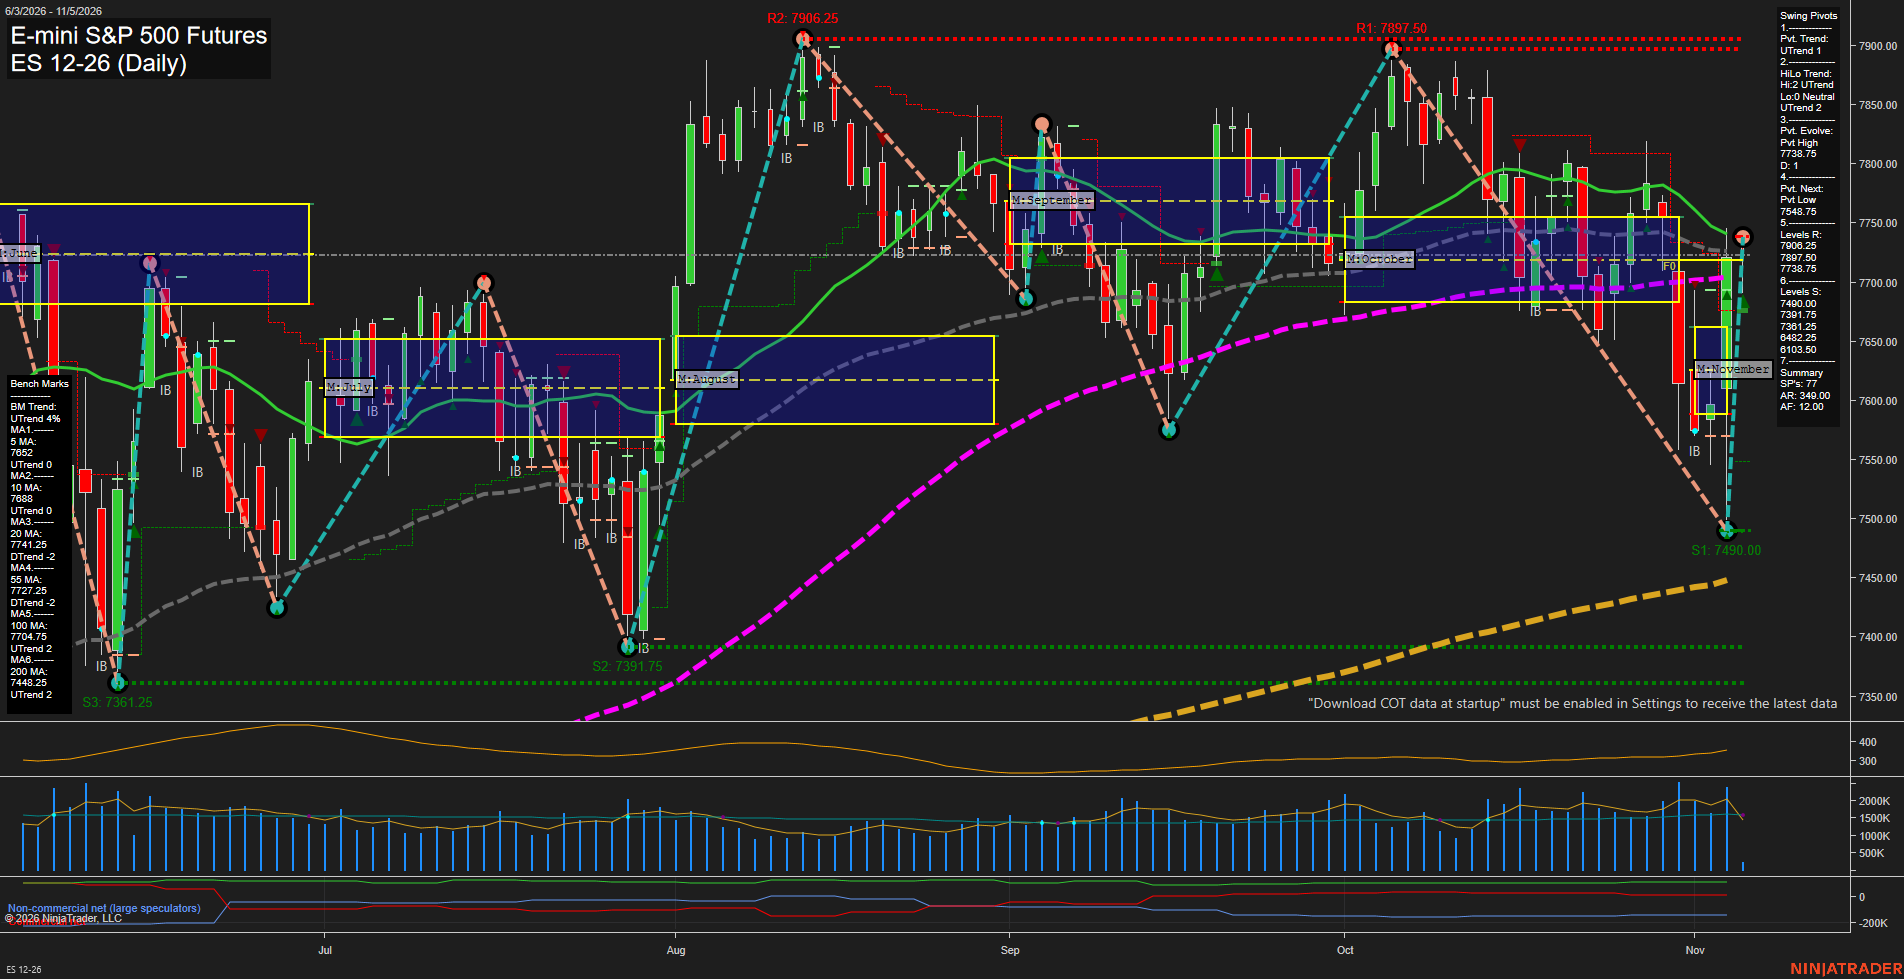
ES E-mini S&P 500 Futures Daily Chart Analysis: 2026-Nov-05 07:03 CT
Price Action
- Last: 7727.75,
- Bars: Large,
- Mom: fast.
WSFG Weekly
- Short-Term
- WSFG Current: 55%
- F0%/NTZ' Bias: Price Above,
- WSFG Trend: Up.
MSFG Month Nov
- Intermediate-Term
- MSFG Current: 34%
- F0%/NTZ' Bias: Price Above,
- MSFG Trend: Up.
YSFG Year 2026
- Long-Term
- YSFG Current: 56%
- F0%/NTZ' Bias: Price Above,
- YSFG Trend: Up.
Swing Pivots
- (Short-Term) 1. Pvt. Trend: UTrend,
- (Intermediate-Term) 2. HiLo Trend: UTrend,
- 3. Pvt. Evolve: Pvt high 7738.75,
- 4. Pvt. Next: Pvt low 7547.85,
- 5. Levels R: 7906.25, 7897.50, 7738.75,
- 6. Levels S: 7490.00, 7391.75, 7381.25, 6842.25, 6733.50.
Daily Benchmarks
- (Short-Term) 5 Day: 7652.00 Up Trend,
- (Short-Term) 10 Day: 7688.00 Up Trend,
- (Intermediate-Term) 20 Day: 7741.25 Down Trend,
- (Intermediate-Term) 55 Day: 7727.25 Down Trend,
- (Long-Term) 100 Day: 7704.75 Up Trend,
- (Long-Term) 200 Day: 7448.25 Up Trend.
Additional Metrics
Recent Trade Signals
- 04 Nov 2026: Long ES 12-26 @ 7674.75 Signals.USAR-MSFG
- 04 Nov 2026: Long ES 12-26 @ 7648.25 Signals.USAR-WSFG
Overall Rating
- Short-Term: Bullish,
- Intermediate-Term: Bullish,
- Long-Term: Bullish.
Key Insights Summary
The daily chart shows a sharp V-style rebound from the 7490 swing-low area, with large-range upside bars restoring fast momentum and returning price above the weekly and monthly Fib-grid centers. Short-term pivot structure is in UTrend and the intermediate HiLo structure remains UTrend, while the 5-day and 10-day averages have turned upward. Price is testing the 55-day benchmark near 7727.25 and remains just beneath the 20-day average and the active 7738.75 pivot-high level, defining a near-term overhead congestion zone. The broader structure remains constructive as price holds above rising 100-day and 200-day benchmarks, while the November grid, yearly grid, and recent long signals retain an upward directional backdrop. ATR at 349 reflects elevated daily range conditions and the recent recovery has retraced much of the late-October selloff.
Chart Analysis ATS AI Generated: 2026-11-05 07:03 for Informational use only, not trading advice. Terms and Risk Disclosure Copyright © 2026. Algo Trading Systems LLC.