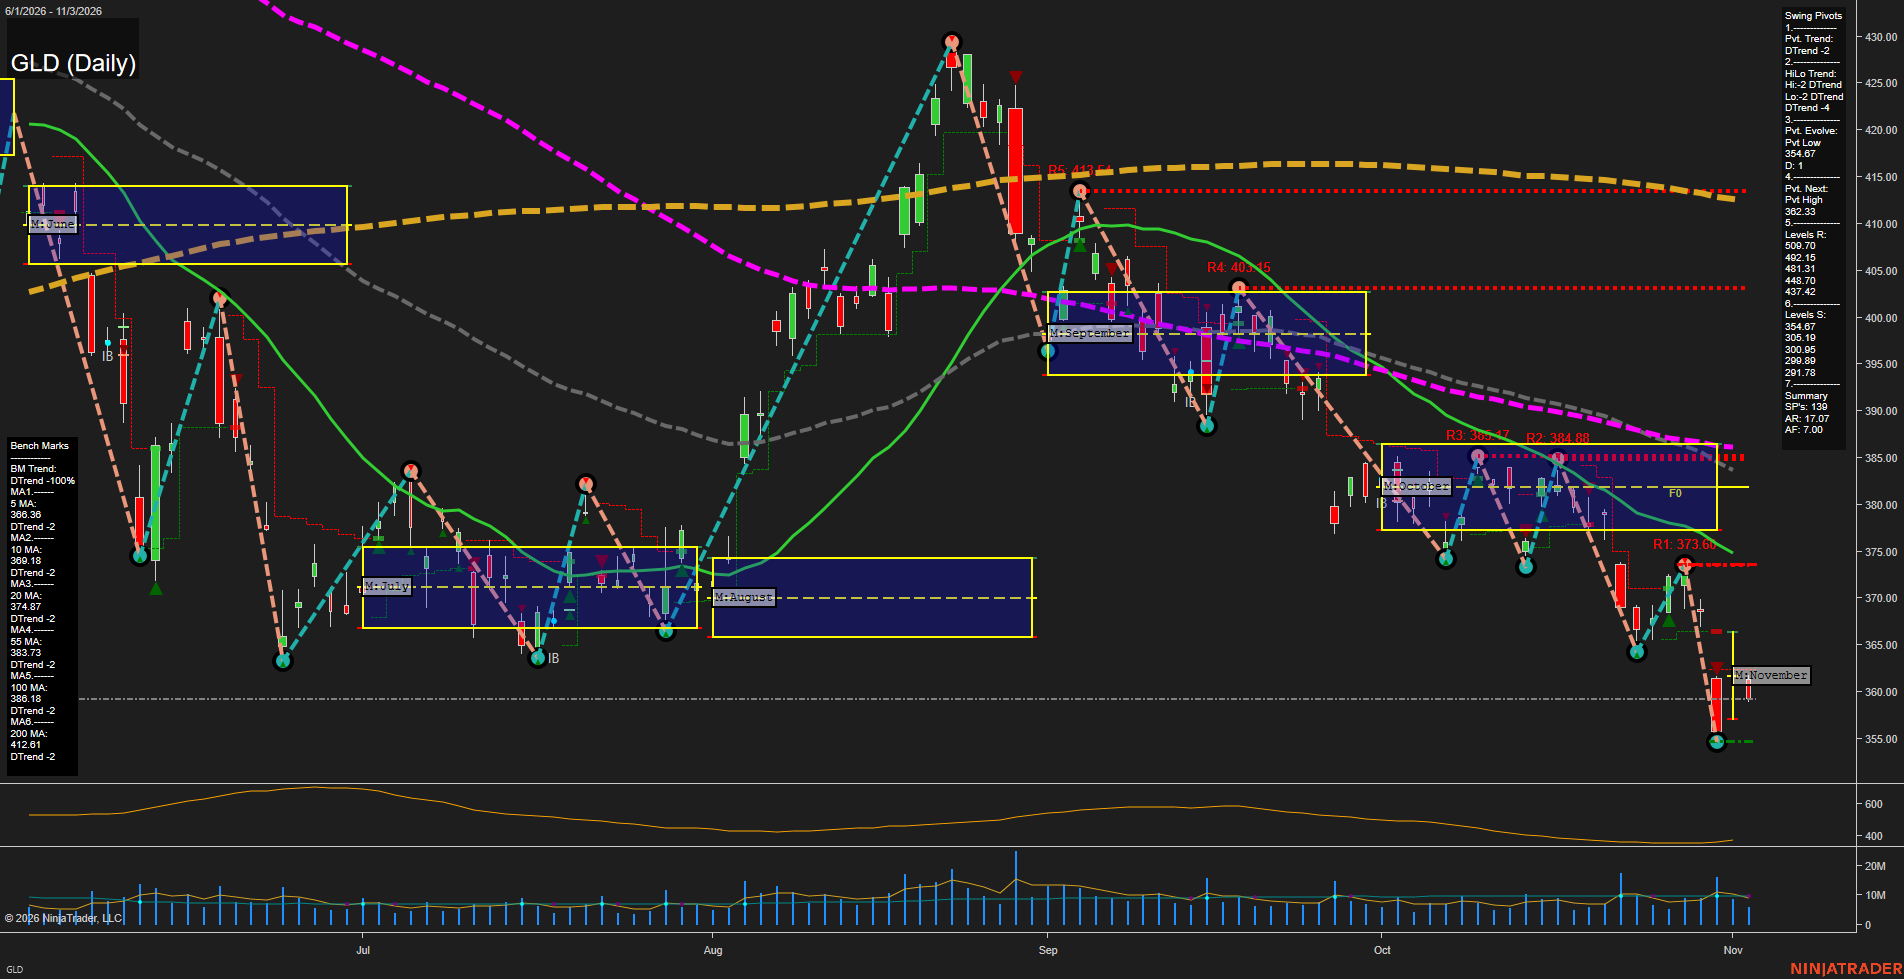
GLD SPDR Gold Shares Daily Chart Analysis: 2026-Nov-04 07:05 CT
Price Action
- Last: 360.50,
- Bars: Large,
- Mom: fast.
WSFG Weekly
- Short-Term
- WSFG Current: NA%
- F0%/NTZ' Bias: Price Neutral,
- WSFG Trend: Neutral.
MSFG Month Nov
- Intermediate-Term
- MSFG Current: 0%
- F0%/NTZ' Bias: Price Neutral,
- MSFG Trend: Neutral.
YSFG Year 2026
- Long-Term
- YSFG Current: NA%
- F0%/NTZ' Bias: Price Neutral,
- YSFG Trend: Neutral.
Swing Pivots
- (Short-Term) 1. Pvt. Trend: DTrend,
- (Intermediate-Term) 2. HiLo Trend: DTrend,
- 3. Pvt. Evolve: Pvt low 356.17,
- 4. Pvt. Next: Pvt high 373.60,
- 5. Levels R: 509.70, 492.15, 481.31, 448.70, 437.42,
- 6. Levels S: 364.67, 305.19, 300.85, 299.89, 291.78.
Daily Benchmarks
- (Short-Term) 5 Day: 365.38 Down Trend,
- (Short-Term) 10 Day: 369.18 Down Trend,
- (Intermediate-Term) 20 Day: 374.87 Down Trend,
- (Intermediate-Term) 55 Day: 383.73 Down Trend,
- (Long-Term) 100 Day: 386.18 Down Trend,
- (Long-Term) 200 Day: 412.61 Down Trend.
Additional Metrics
- ATR: 170,
- VOLMA: 7000000.
Overall Rating
- Short-Term: Bearish,
- Intermediate-Term: Bearish,
- Long-Term: Bearish.
Key Insights Summary
GLD reflects a broad futures-style liquidation structure: price is beneath every daily benchmark, all benchmark slopes are down, and both the short-term pivot trend and intermediate HiLo trend remain in DTrend. The decline from the October rebound has produced lower highs and lower lows, with momentum accelerating into the 356.17 pivot low area. The 373.60 pivot-next level defines the nearby countertrend reversal threshold, while the 364.67 area is the closest prior support reference now overhead after the breakdown. The November monthly grid is newly established around current pricing, showing a reset period following a sharp downside expansion. Elevated ATR conditions and firm volume activity characterize a volatile directional decline rather than a stable consolidation.
Chart Analysis ATS AI Generated: 2026-11-04 07:05 for Informational use only, not trading advice. Terms and Risk Disclosure Copyright © 2026. Algo Trading Systems LLC.