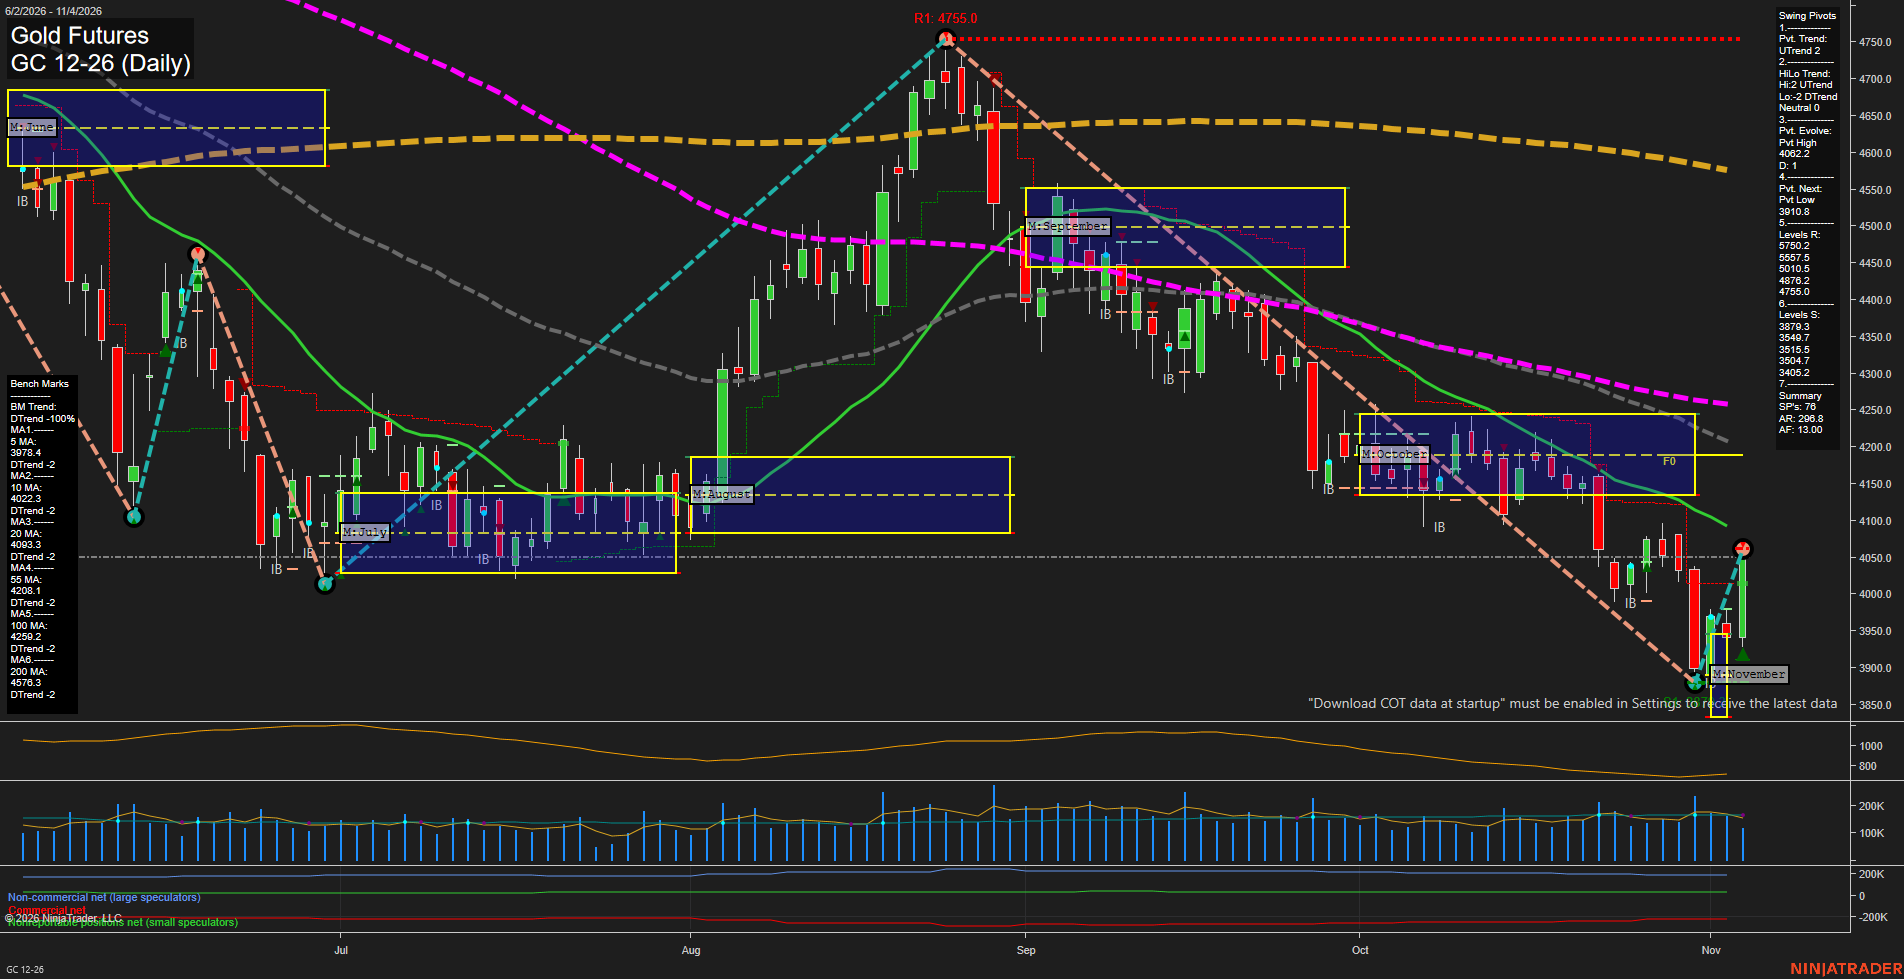
GC Gold Futures Daily Chart Analysis: 2026-Nov-04 07:05 CT
Price Action
- Last: 4057.0,
- Bars: Medium,
- Mom: Fast.
WSFG Weekly
- Short-Term
- WSFG Current: 90%
- F0%/NTZ' Bias: Price Above,
- WSFG Trend: Up.
MSFG Month Nov
- Intermediate-Term
- MSFG Current: 38%
- F0%/NTZ' Bias: Price Below,
- MSFG Trend: Down.
YSFG Year 2026
- Long-Term
- YSFG Current: -135%
- F0%/NTZ' Bias: Price Below,
- YSFG Trend: Down.
Swing Pivots
- (Short-Term) 1. Pvt. Trend: UTrend,
- (Intermediate-Term) 2. HiLo Trend: UTrend,
- 3. Pvt. Evolve: Pvt high 4062.2,
- 4. Pvt. Next: Pvt low 3910.8,
- 5. Levels R: 5750.2, 5597.5, 5010.5, 4876.2, 4755.0,
- 6. Levels S: 3879.3, 3549.7, 3515.5, 3504.7, 3405.2.
Daily Benchmarks
- (Short-Term) 5 Day: 3978.4 Down Trend,
- (Short-Term) 10 Day: 4022.3 Down Trend,
- (Intermediate-Term) 20 Day: 4093.3 Down Trend,
- (Intermediate-Term) 55 Day: 4208.1 Down Trend,
- (Long-Term) 100 Day: 4259.1 Down Trend,
- (Long-Term) 200 Day: 4576.3 Down Trend.
Additional Metrics
- ATR: 296.8,
- VOLMA: 130.0.
Recent Trade Signals
- 03 Nov 2026: Long GC 12-26 @ 3931.5 Signals.USAR-WSFG
- 02 Nov 2026: Long GC 12-26 @ 3977.9 Signals.USAR-MSFG
- 27 Oct 2026: Long GC 12-26 @ 4074.7 Signals.USAR.TR120
Overall Rating
- Short-Term: Neutral,
- Intermediate-Term: Bearish,
- Long-Term: Bearish.
Key Insights Summary
Price is staging a sharp V-shaped rebound from the 3879.3 swing-support area, producing a short-term UTrend and a fast recovery in momentum. The rebound has lifted price above the 5-day and 10-day benchmarks, but price remains beneath the declining 20-, 55-, 100-, and 200-day averages, preserving a broader bearish moving-average structure. The November MSFG remains below its F0% area, while the weekly structure and newly formed pivot sequence reflect counter-trend strength. The 4062.2 evolving pivot high and nearby 4093.3 20-day average form the immediate technical test zone; failure to sustain the rebound would retain focus on 3910.8 and 3879.3 support. Elevated ATR conditions indicate wide daily ranges and an active, volatile swing environment.
Chart Analysis ATS AI Generated: 2026-11-04 07:05 for Informational use only, not trading advice. Terms and Risk Disclosure Copyright © 2026. Algo Trading Systems LLC.