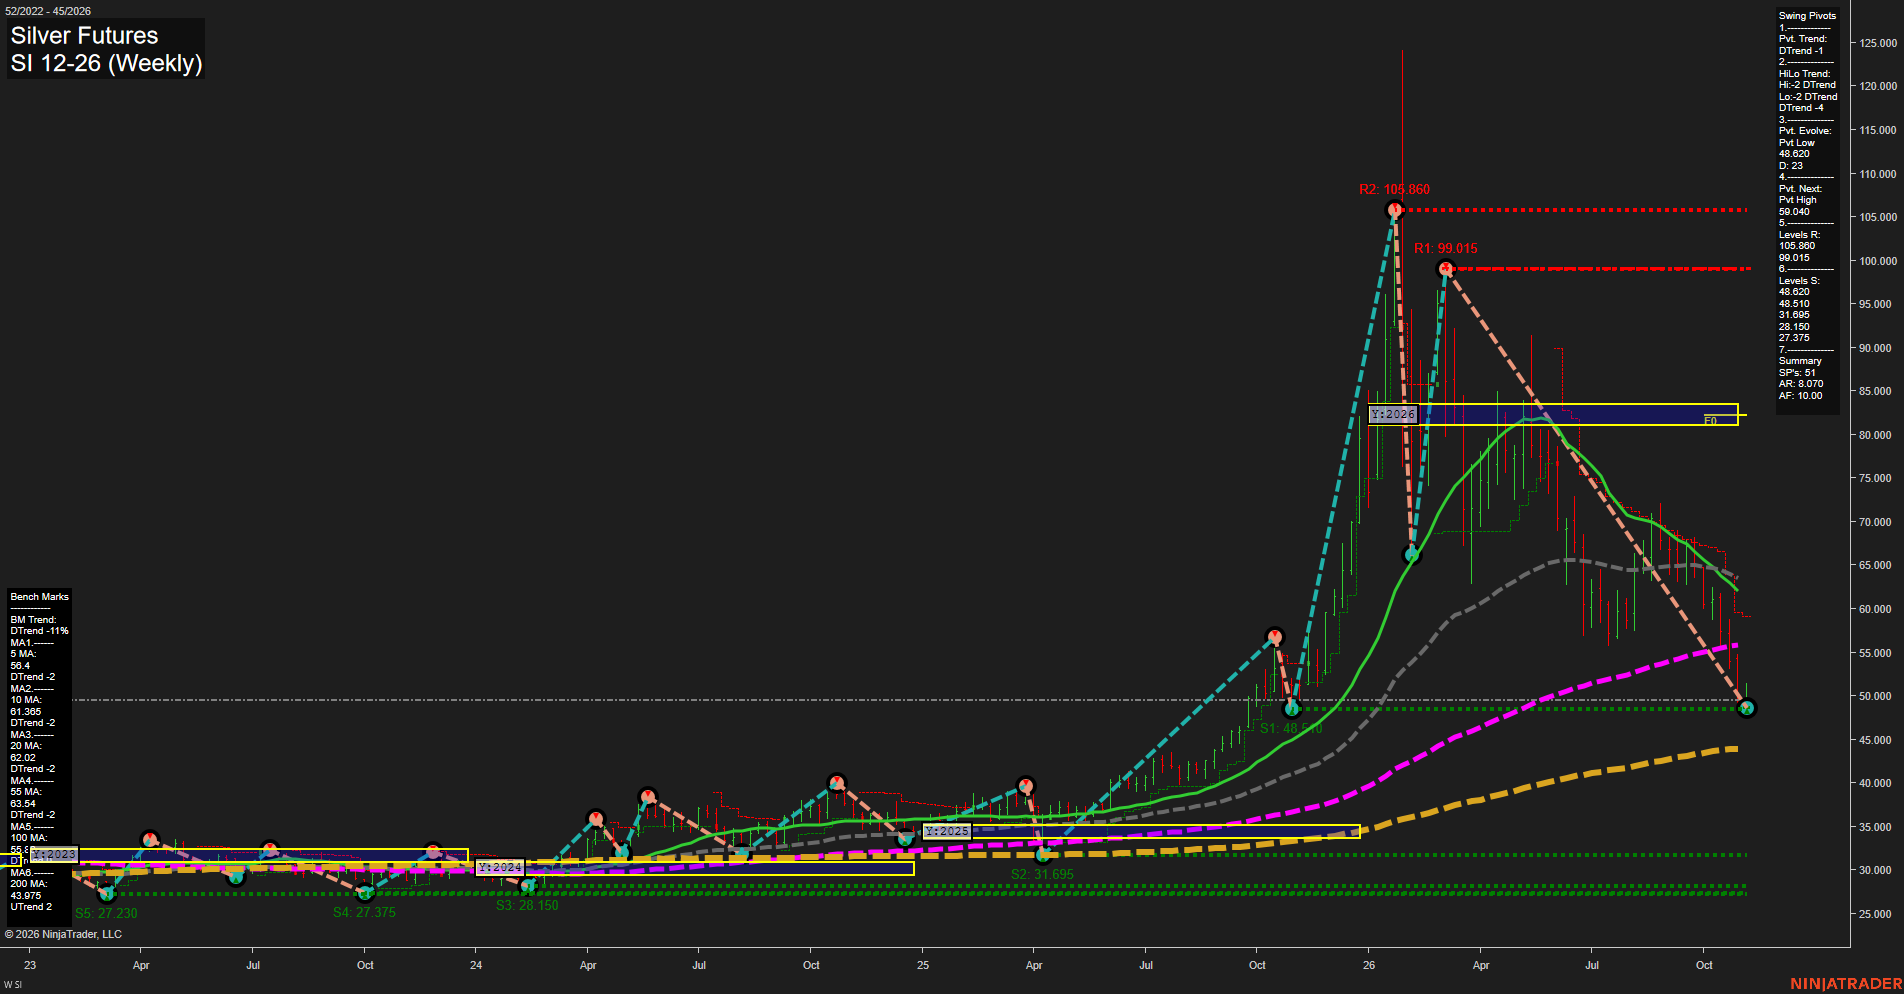
SI Silver Futures Weekly Chart Analysis: 2026-Nov-03 07:09 CT
Price Action
- Last: 51.055,
- Bars: Medium,
- Mom: Average.
WSFG Weekly
- Short-Term
- WSFG Current: 9%
- F0%/NTZ' Bias: Price Above,
- WSFG Trend: Up.
MSFG Month Nov
- Intermediate-Term
- MSFG Current: 4%
- F0%/NTZ' Bias: Price Above,
- MSFG Trend: Up.
YSFG Year 2026
- Long-Term
- YSFG Current: -271%
- F0%/NTZ' Bias: Price Below,
- YSFG Trend: Down.
Swing Pivots
- (Short-Term) 1. Pvt. Trend: DTrend,
- (Intermediate-Term) 2. HiLo Trend: DTrend,
- 3. Pvt. Evolve: Pvt Low 48.620,
- 4. Pvt. Next: Pvt High 59.040,
- 5. Levels R: 105.860, 99.015,
- 6. Levels S: 48.620, 48.510, 31.695, 28.150, 27.375.
Weekly Benchmarks
- (Short-Term) 5 Day: 56.410 Down Trend,
- (Short-Term) 10 Day: 61.385 Down Trend,
- (Intermediate-Term) 20 Day: 62.015 Down Trend,
- (Intermediate-Term) 55 Day: 63.540 Down Trend,
- (Long-Term) 100 Day: 55.700 Up Trend,
- (Long-Term) 200 Day: 43.975 Up Trend.
Recent Trade Signals
- 02 Nov 2026: Long SI 12-26 @ 51.055 Signals.USAR-MSFG
- 28 Oct 2026: Short SI 12-26 @ 53.585 Signals.USAR-WSFG
Overall Rating
- Short-Term: Bearish,
- Intermediate-Term: Bearish,
- Long-Term: Bullish.
Key Insights Summary
Silver is staging a rebound from the 48.620 pivot-low area after an exceptionally volatile decline from the 99.015 and 105.860 swing highs. The weekly and monthly Fib grids remain positive, but the active pivot and HiLo structures are both downtrends, with price below the declining 5, 10, 20, and 55-period benchmarks. The 48.620 to 48.510 area defines the immediate structural floor, while 59.040 is the next pivot-reversal threshold. The longer-term structure retains a bullish foundation above the rising 200-period benchmark, although the yearly Fib grid and price position below the 100-period benchmark show that the 2026 correction remains unresolved.
Chart Analysis ATS AI Generated: 2026-11-03 07:10 for Informational use only, not trading advice. Terms and Risk Disclosure Copyright © 2026. Algo Trading Systems LLC.