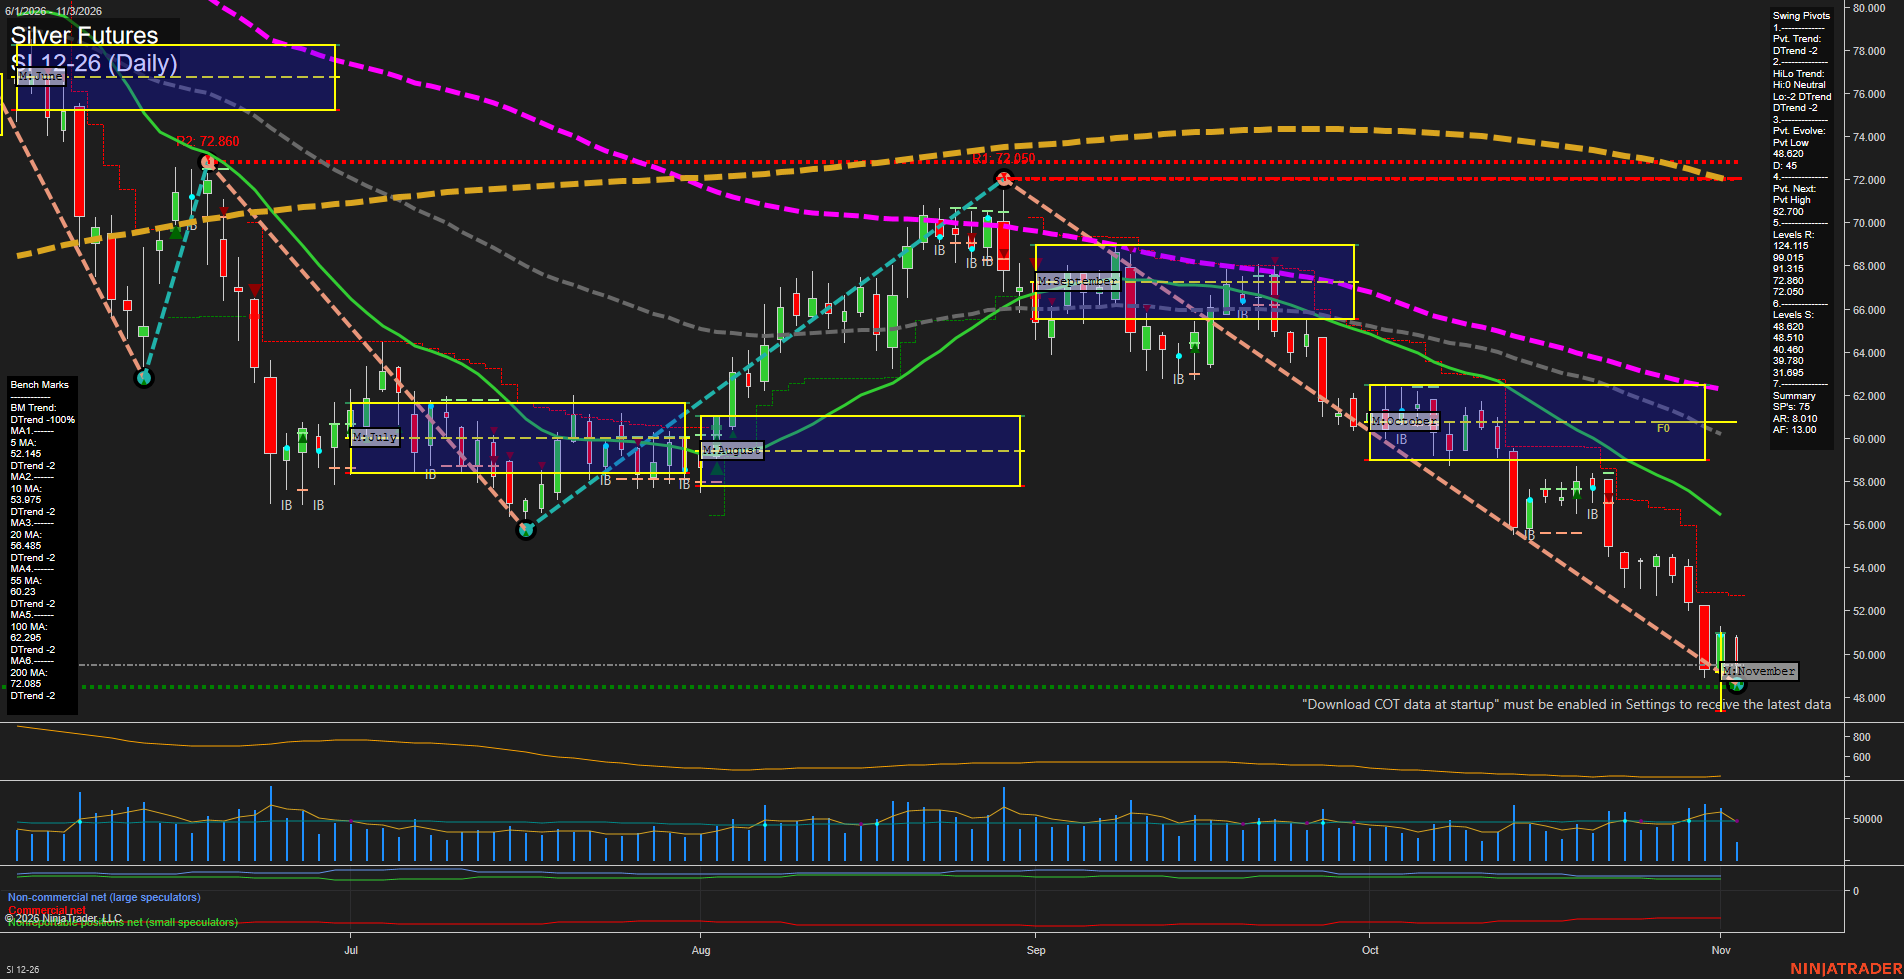
SI Silver Futures Daily Chart Analysis: 2026-Nov-03 07:09 CT
Price Action
- Last: 48.620,
- Bars: Large,
- Mom: fast.
WSFG Weekly
- Short-Term
- WSFG Current: 9%
- F0%/NTZ' Bias: Price Above,
- WSFG Trend: Up.
MSFG Month Nov
- Intermediate-Term
- MSFG Current: 4%
- F0%/NTZ' Bias: Price Above,
- MSFG Trend: Up.
YSFG Year 2026
- Long-Term
- YSFG Current: -271%
- F0%/NTZ' Bias: Price Below,
- YSFG Trend: Down.
Swing Pivots
- (Short-Term) 1. Pvt. Trend: DTrend,
- (Intermediate-Term) 2. HiLo Trend: DTrend,
- 3. Pvt. Evolve: Pvt low 48.620,
- 4. Pvt. Next: Pvt high 52.070,
- 5. Levels R: 91.415, 91.315, 72.860, 72.050,
- 6. Levels S: 48.620, 48.510, 40.470, 39.780, 31.695.
Daily Benchmarks
- (Short-Term) 5 Day: 52.145 Down Trend,
- (Short-Term) 10 Day: 53.975 Down Trend,
- (Intermediate-Term) 20 Day: 56.495 Down Trend,
- (Intermediate-Term) 55 Day: 60.230 Down Trend,
- (Long-Term) 100 Day: 62.290 Down Trend,
- (Long-Term) 200 Day: 72.085 Down Trend.
Additional Metrics
Recent Trade Signals
- 02 Nov 2026: Long SI 12-26 @ 51.055 Signals.USAR-MSFG
- 28 Oct 2026: Short SI 12-26 @ 53.585 Signals.USAR-WSFG
Overall Rating
- Short-Term: Bearish,
- Intermediate-Term: Bearish,
- Long-Term: Bearish.
Key Insights Summary
Silver futures are in a decisive daily-chart decline, with large-range bars, fast downside momentum, and price at the active 48.620 pivot-low area. Price is beneath every displayed benchmark from the 5-day through the 200-day average, confirming broad bearish alignment across swing horizons. The October-November leg shows persistent lower highs and lower lows following rejection beneath the monthly grid and the 60.230 to 62.290 moving-average region. The 48.620 and 48.510 supports define the immediate pivot zone, while 52.070 is the next pivot-reversal reference; the chart structure remains downside-dominant unless that lower-high sequence changes.
Chart Analysis ATS AI Generated: 2026-11-03 07:09 for Informational use only, not trading advice. Terms and Risk Disclosure Copyright © 2026. Algo Trading Systems LLC.