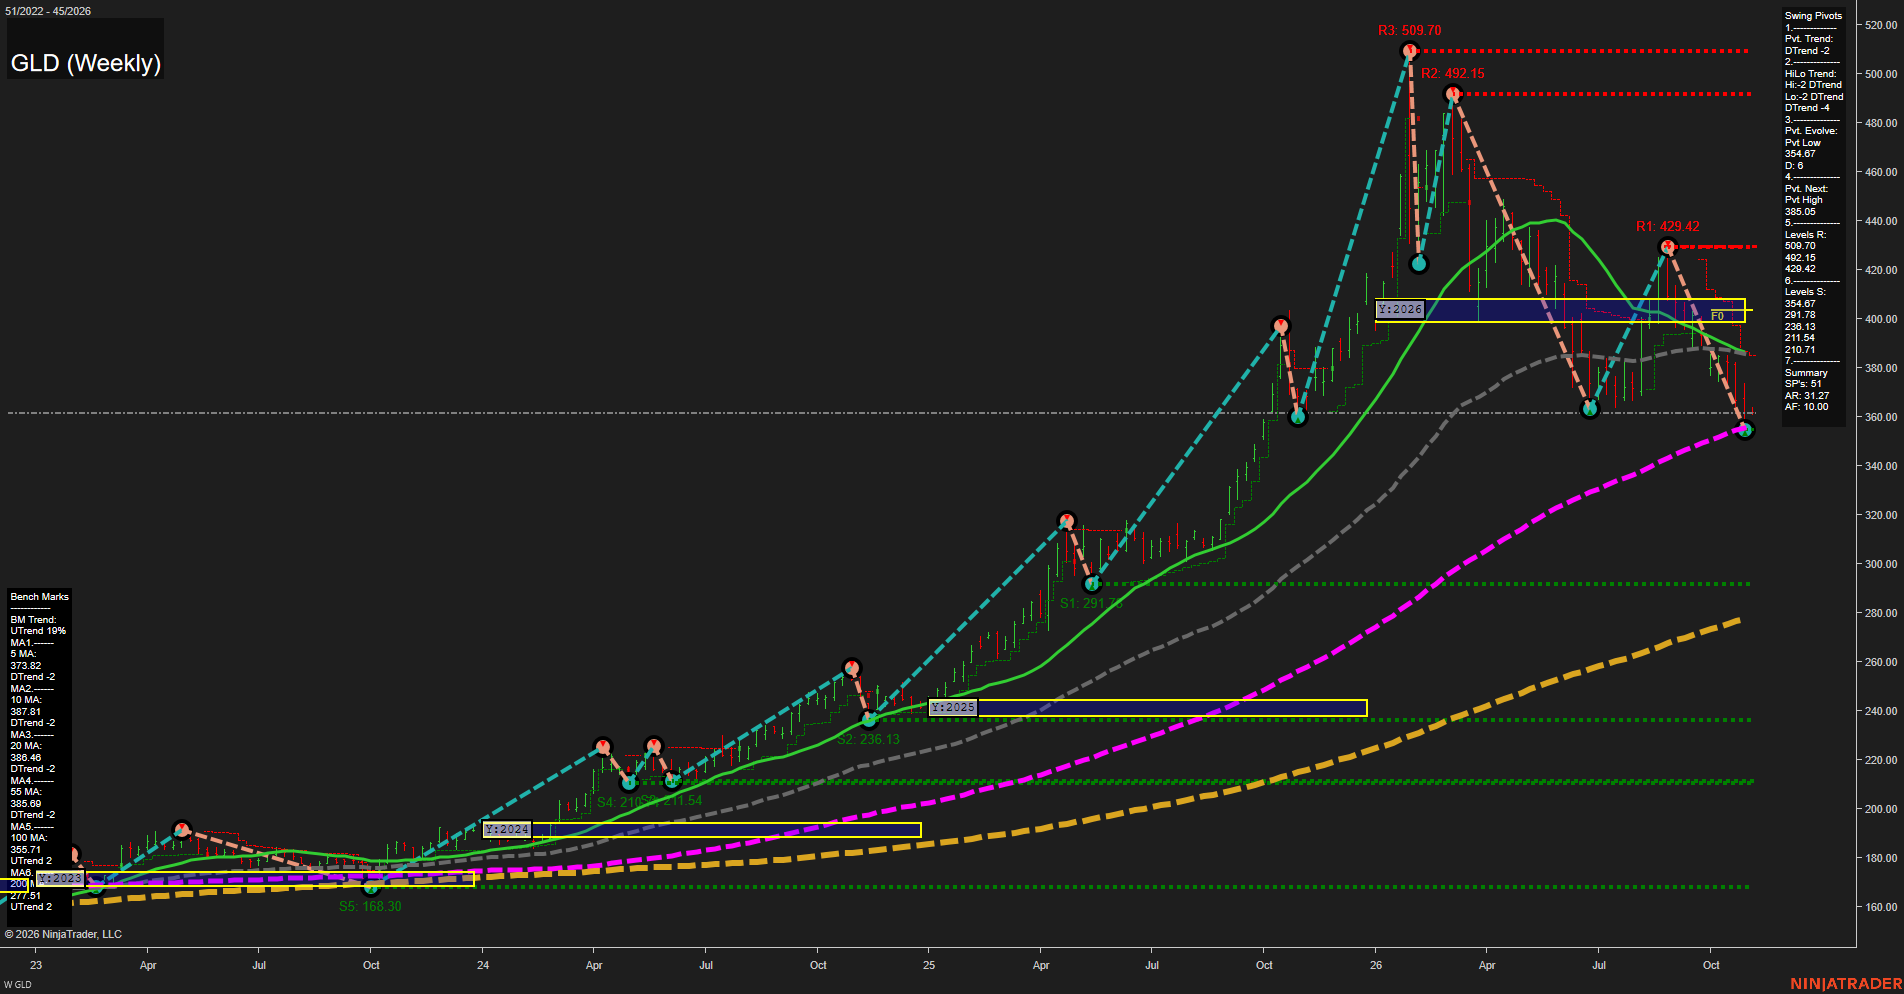
GLD SPDR Gold Shares Weekly Chart Analysis: 2026-Nov-03 07:06 CT
Price Action
- Last: 354.67,
- Bars: Medium,
- Mom: Fast.
WSFG Weekly
- Short-Term
- WSFG Current: NA%
- F0%/NTZ' Bias: Price Neutral,
- WSFG Trend: Neutral.
MSFG Month Nov
- Intermediate-Term
- MSFG Current: NA%
- F0%/NTZ' Bias: Price Neutral,
- MSFG Trend: Neutral.
YSFG Year 2026
- Long-Term
- YSFG Current: NA%
- F0%/NTZ' Bias: Price Below NTZ,
- YSFG Trend: Bearish.
Swing Pivots
- (Short-Term) 1. Pvt. Trend: DTrend,
- (Intermediate-Term) 2. HiLo Trend: DTrend,
- 3. Pvt. Evolve: Pvt low 354.67,
- 4. Pvt. Next: Pvt high 385.05,
- 5. Levels R: 509.70, 492.15, 429.42,
- 6. Levels S: 354.67, 291.78, 236.13, 211.54, 210.02, 168.30.
Weekly Benchmarks
- (Short-Term) 5 Day: 373.82 Down Trend,
- (Short-Term) 10 Day: 387.81 Down Trend,
- (Intermediate-Term) 20 Day: 386.46 Down Trend,
- (Intermediate-Term) 55 Day: 385.69 Down Trend,
- (Long-Term) 100 Day: 355.71 Down Trend,
- (Long-Term) 200 Day: 277.51 Up Trend.
Overall Rating
- Short-Term: Bearish,
- Intermediate-Term: Bearish,
- Long-Term: Neutral.
Key Insights Summary
GLD, as a liquid gold-futures proxy, reflects a fast weekly downswing from the 429.42 pivot high into the active 354.67 pivot-low area. Price is below all short and intermediate benchmark averages and marginally below the declining 100-period benchmark, confirming a broad countertrend liquidation phase. The pivot sequence remains lower-high/lower-low bearish, with 385.05 defining the next upside pivot reversal reference and 429.42 the larger overhead resistance zone. The longer secular structure is mixed rather than fully bearish because the rising 200-period benchmark remains materially below price; however, the yearly grid has been lost to the downside and the current weekly structure is dominated by downside momentum and elevated swing volatility.
Chart Analysis ATS AI Generated: 2026-11-03 07:07 for Informational use only, not trading advice. Terms and Risk Disclosure Copyright © 2026. Algo Trading Systems LLC.