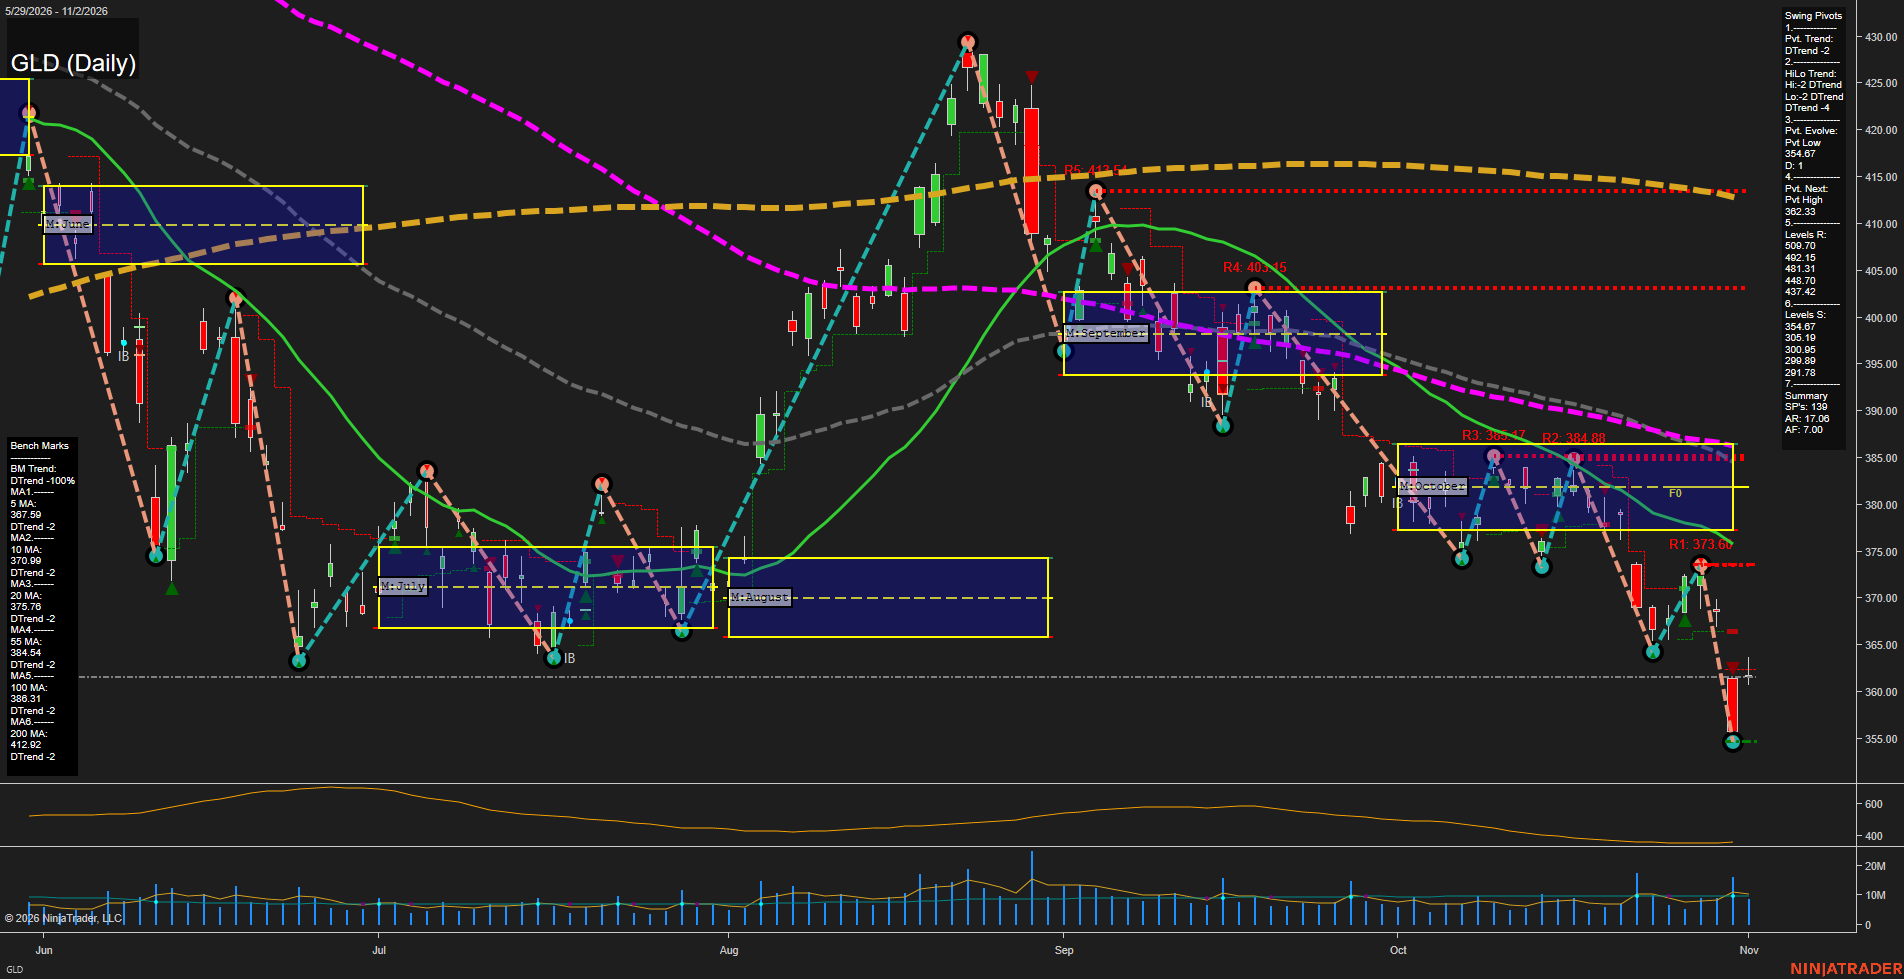
GLD SPDR Gold Shares Daily Chart Analysis: 2026-Nov-03 07:06 CT
Price Action
- Last: 360.80,
- Bars: Large,
- Mom: fast.
WSFG Weekly
- Short-Term
- WSFG Current: NA%
- F0%/NTZ' Bias: Price Bearish,
- WSFG Trend: Bearish.
MSFG Month Nov
- Intermediate-Term
- MSFG Current: NA%
- F0%/NTZ' Bias: Price Bearish,
- MSFG Trend: Bearish.
YSFG Year 2026
- Long-Term
- YSFG Current: NA%
- F0%/NTZ' Bias: Price Bearish,
- YSFG Trend: Bearish.
Swing Pivots
- (Short-Term) 1. Pvt. Trend: DTrend,
- (Intermediate-Term) 2. HiLo Trend: DTrend,
- 3. Pvt. Evolve: Pvt low 356.47,
- 4. Pvt. Next: Pvt high 369.70,
- 5. Levels R: 509.70, 492.15, 481.31, 448.70, 437.42,
- 6. Levels S: 364.67, 305.19, 304.85, 299.89, 291.78.
Daily Benchmarks
- (Short-Term) 5 Day: 367.69 Down Trend,
- (Short-Term) 10 Day: 370.99 Down Trend,
- (Intermediate-Term) 20 Day: 375.78 Down Trend,
- (Intermediate-Term) 55 Day: 384.54 Down Trend,
- (Long-Term) 100 Day: 386.31 Down Trend,
- (Long-Term) 200 Day: 412.92 Down Trend.
Additional Metrics
- ATR: 17.08,
- VOLMA: 7000000.
Overall Rating
- Short-Term: Bearish,
- Intermediate-Term: Bearish,
- Long-Term: Bearish.
Key Insights Summary
GLD displays a broad, synchronized bearish structure: price is beneath every benchmark average, both pivot-trend measures are in DTrend, and the recent decline accelerated through the 364.67 support area. The latest large-range selloff produced a new 356.47 pivot low, while the next pivot reversal reference is 369.70. Futures-style swing conditions remain high momentum and volatile, with the 5-, 10-, and 20-day averages acting as overhead trend pressure and the 55- through 200-day averages confirming the larger downside cycle. The breakdown from the October range reflects lower highs and lower lows; 364.67 has shifted from prior support into the nearest structural resistance zone.
Chart Analysis ATS AI Generated: 2026-11-03 07:06 for Informational use only, not trading advice. Terms and Risk Disclosure Copyright © 2026. Algo Trading Systems LLC.