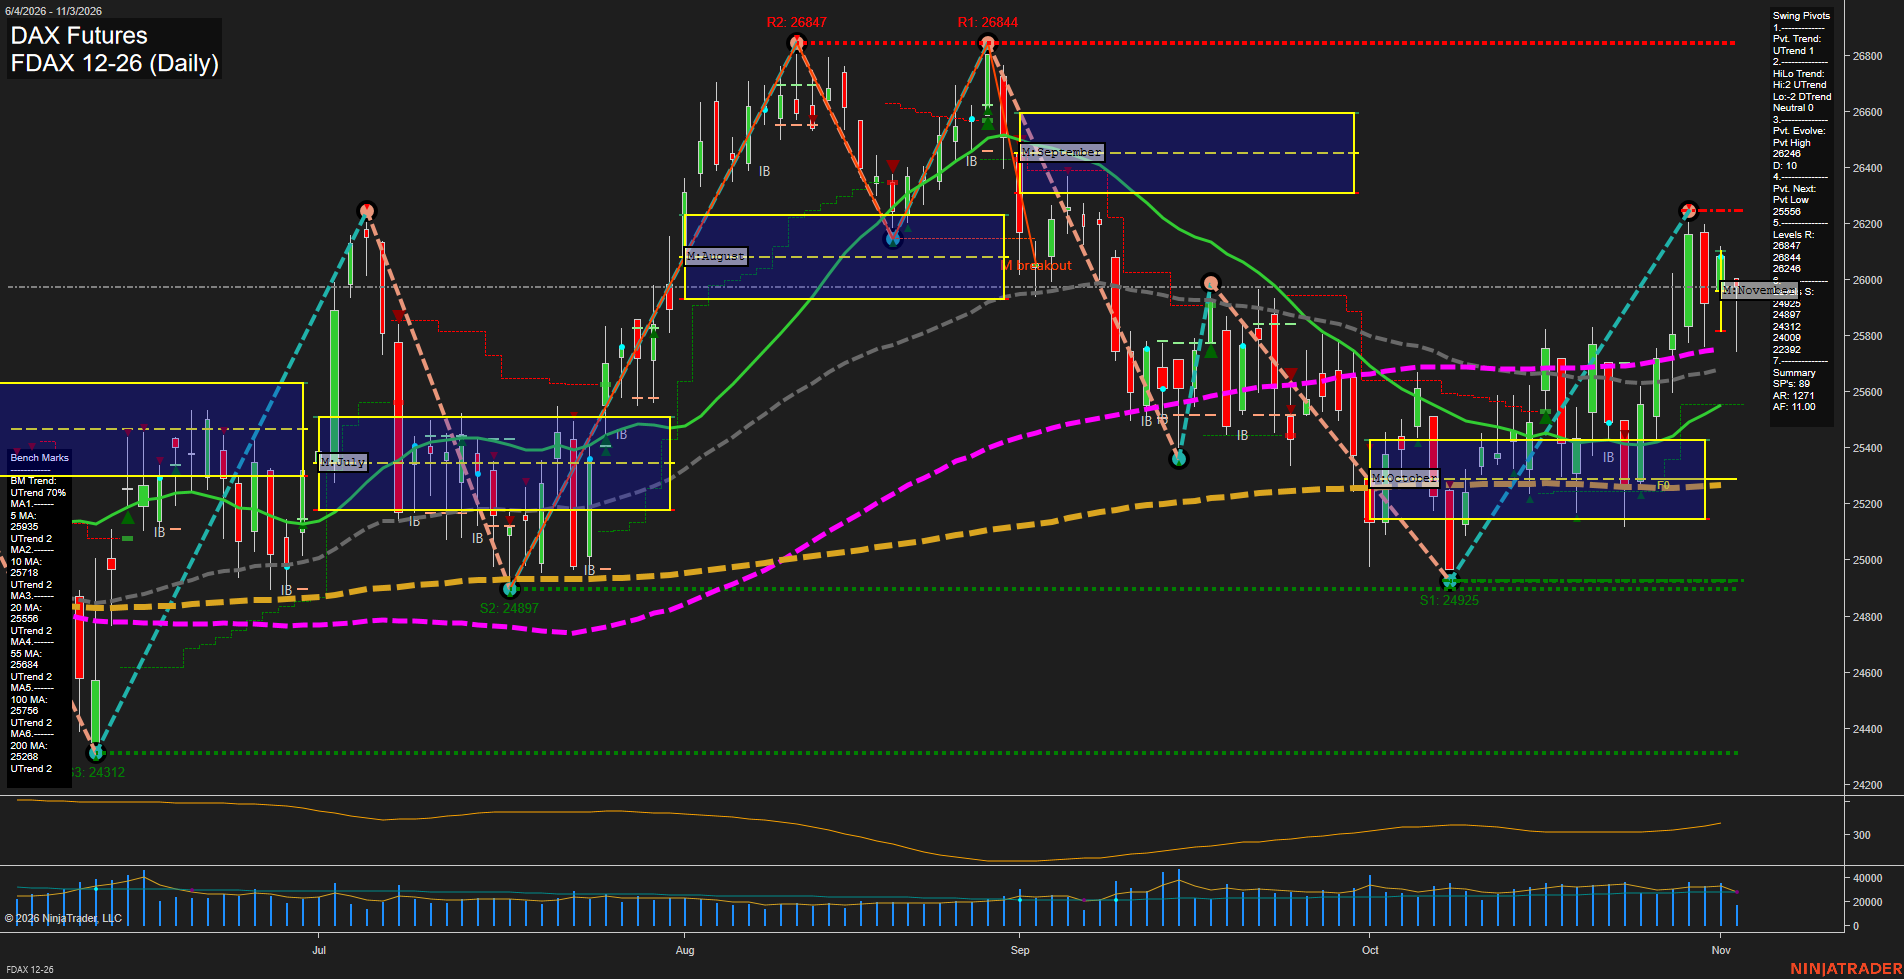
FDAX DAX Futures Daily Chart Analysis: 2026-Nov-03 07:05 CT
Price Action
- Last: 25915,
- Bars: Small,
- Mom: Average.
WSFG Weekly
- Short-Term
- WSFG Current: 0%
- F0%/NTZ' Bias: Price Neutral,
- WSFG Trend: Neutral.
MSFG Month Nov
- Intermediate-Term
- MSFG Current: 0%
- F0%/NTZ' Bias: Price Neutral,
- MSFG Trend: Neutral.
YSFG Year 2026
- Long-Term
- YSFG Current: 26%
- F0%/NTZ' Bias: Price Above,
- YSFG Trend: Up.
Swing Pivots
- (Short-Term) 1. Pvt. Trend: UTrend,
- (Intermediate-Term) 2. HiLo Trend: UTrend,
- 3. Pvt. Evolve: Pvt high 26246,
- 4. Pvt. Next: Pvt low 25558,
- 5. Levels R: 26847, 26844, 26248,
- 6. Levels S: 24925, 24897, 24312, 24009, 23999.
Daily Benchmarks
- (Short-Term) 5 Day: 25935 Up Trend,
- (Short-Term) 10 Day: 25718 Up Trend,
- (Intermediate-Term) 20 Day: 25556 Up Trend,
- (Intermediate-Term) 55 Day: 25684 Up Trend,
- (Long-Term) 100 Day: 25756 Up Trend,
- (Long-Term) 200 Day: 25268 Up Trend.
Additional Metrics
Recent Trade Signals
- 03 Nov 2026: Short FDAX 12-26 @ 25883 Signals.USAR-WSFG
- 03 Nov 2026: Short FDAX 12-26 @ 25815 Signals.USAR-MSFG
- 27 Oct 2026: Long FDAX 12-26 @ 25576 Signals.USAR.TR120
Overall Rating
- Short-Term: Bullish,
- Intermediate-Term: Bullish,
- Long-Term: Bullish.
Key Insights Summary
FDAX remains in a broad daily-chart recovery structure following the October low near 24925, with higher lows and all six benchmark averages rising. Price is consolidating beneath the recent 26246 pivot high after a sharp late-October advance, leaving short-term action choppy and contained between the 25558 pivot-reversal area and 26248 resistance. The current small bar and position near the 5-day average reflect slowing momentum rather than a confirmed trend failure. The active WSFG and MSFG short signals highlight countertrend pressure near the recent upper range, while the positive pivot structure, rising intermediate averages, and price well above the 200-day benchmark preserve the prevailing bullish longer-cycle backdrop.
Chart Analysis ATS AI Generated: 2026-11-03 07:05 for Informational use only, not trading advice. Terms and Risk Disclosure Copyright © 2026. Algo Trading Systems LLC.