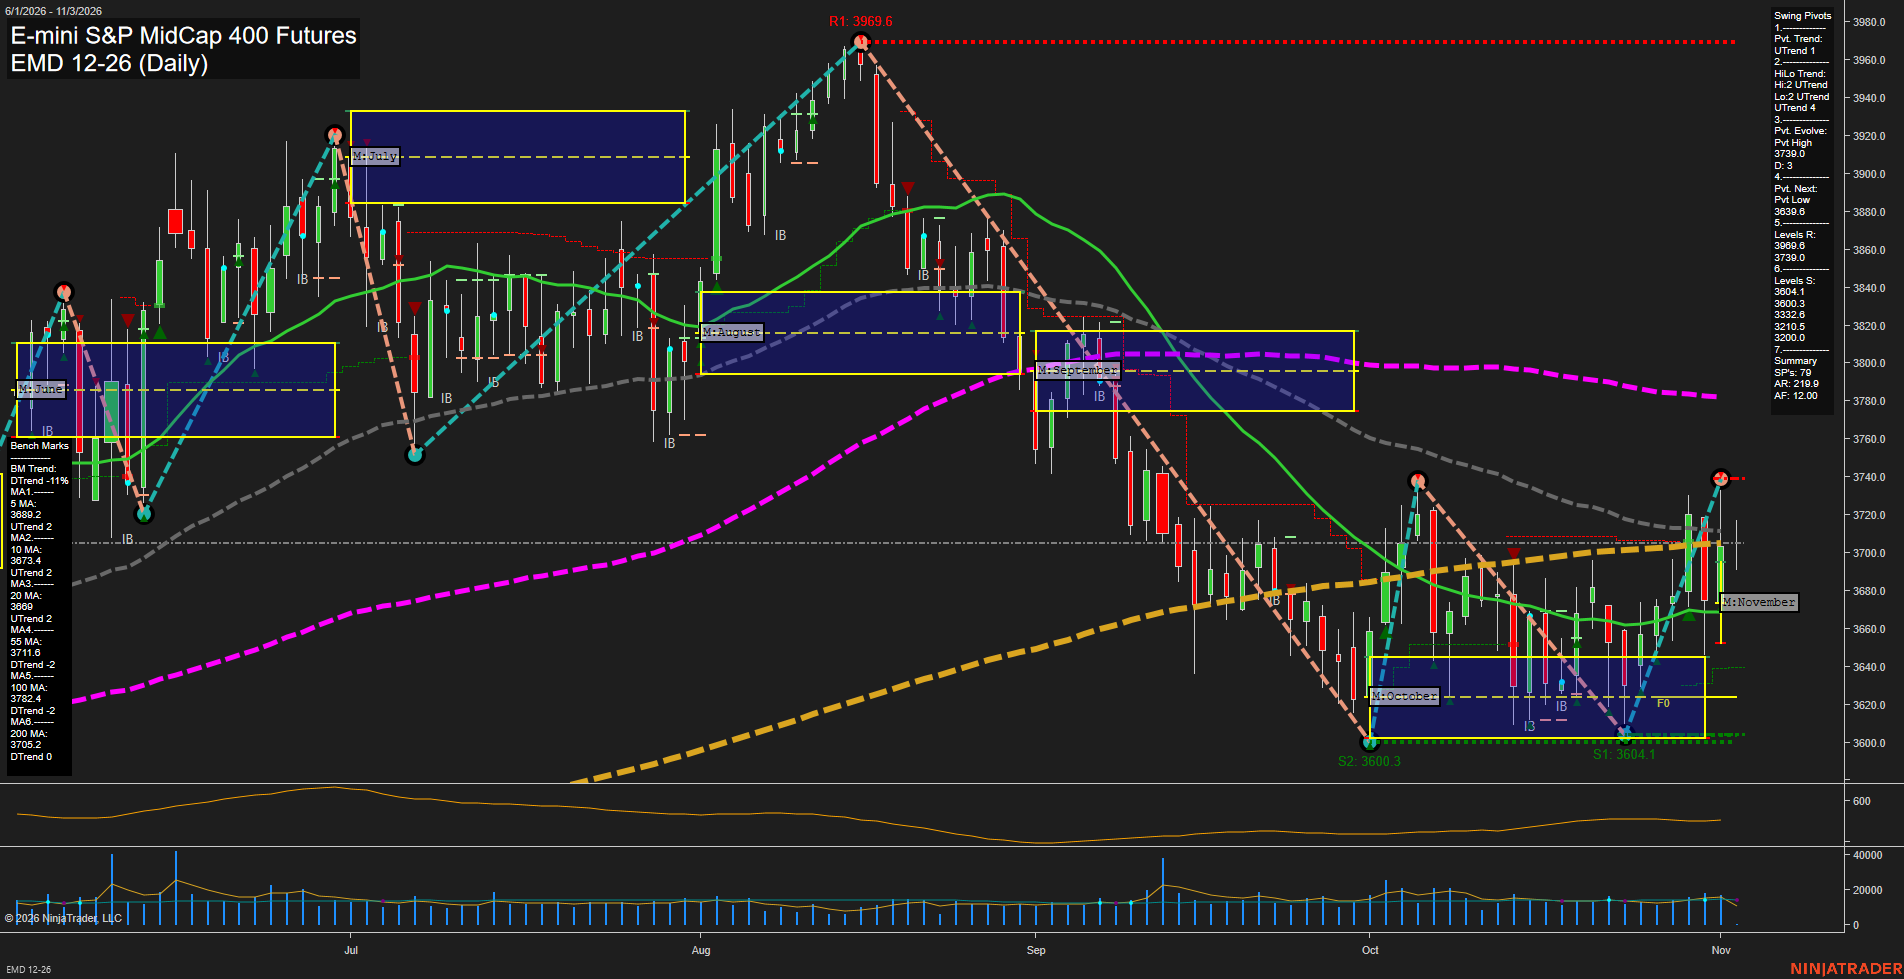
EMD E-mini S&P MidCap 400 Futures Daily Chart Analysis: 2026-Nov-03 07:03 CT
Price Action
- Last: 3702.5,
- Bars: Medium,
- Mom: Average.
WSFG Weekly
- Short-Term
- WSFG Current: 31%
- F0%/NTZ' Bias: Price Above,
- WSFG Trend: Up.
MSFG Month Nov
- Intermediate-Term
- MSFG Current: 18%
- F0%/NTZ' Bias: Price Above,
- MSFG Trend: Up.
YSFG Year 2026
- Long-Term
- YSFG Current: 38%
- F0%/NTZ' Bias: Price Above,
- YSFG Trend: Up.
Swing Pivots
- (Short-Term) 1. Pvt. Trend: UTrend,
- (Intermediate-Term) 2. HiLo Trend: UTrend,
- 3. Pvt. Evolve: Pvt high 3739.8,
- 4. Pvt. Next: Pvt low 3639.6,
- 5. Levels R: 3989.6, 3739.0,
- 6. Levels S: 3604.1, 3600.3, 3322.6, 3210.5, 3200.0.
Daily Benchmarks
- (Short-Term) 5 Day: 3689.2 Up Trend,
- (Short-Term) 10 Day: 3673.4 Up Trend,
- (Intermediate-Term) 20 Day: 3686.6 Up Trend,
- (Intermediate-Term) 55 Day: 3711.6 Down Trend,
- (Long-Term) 100 Day: 3782.4 Down Trend,
- (Long-Term) 200 Day: 3705.2 Down Trend.
Additional Metrics
Recent Trade Signals
- 03 Nov 2026: Long EMD 12-26 @ 3702.5 Signals.USAR-MSFG
- 27 Oct 2026: Long EMD 12-26 @ 3668.5 Signals.USAR.TR120
- 26 Oct 2026: Long EMD 12-26 @ 3656 Signals.USAR-WSFG
Overall Rating
- Short-Term: Bullish,
- Intermediate-Term: Bullish,
- Long-Term: Neutral.
Key Insights Summary
EMD is displaying a short-term recovery structure from the October low near 3600, with higher swing lows and price holding above the weekly and monthly F0% reference areas. The 5-, 10-, and 20-day benchmarks have turned upward, confirming improving near-term momentum, while the active pivot trend and HiLo trend remain positive. The rebound is testing the 3705 to 3712 area where the 200-day and 55-day averages converge; the 3739 pivot high is the next prominent overhead swing reference. Longer-term structure remains mixed because price is still beneath the declining 55-, 100-, and 200-day benchmark cluster, reflecting a broader corrective phase despite the current recovery.
Chart Analysis ATS AI Generated: 2026-11-03 07:03 for Informational use only, not trading advice. Terms and Risk Disclosure Copyright © 2026. Algo Trading Systems LLC.