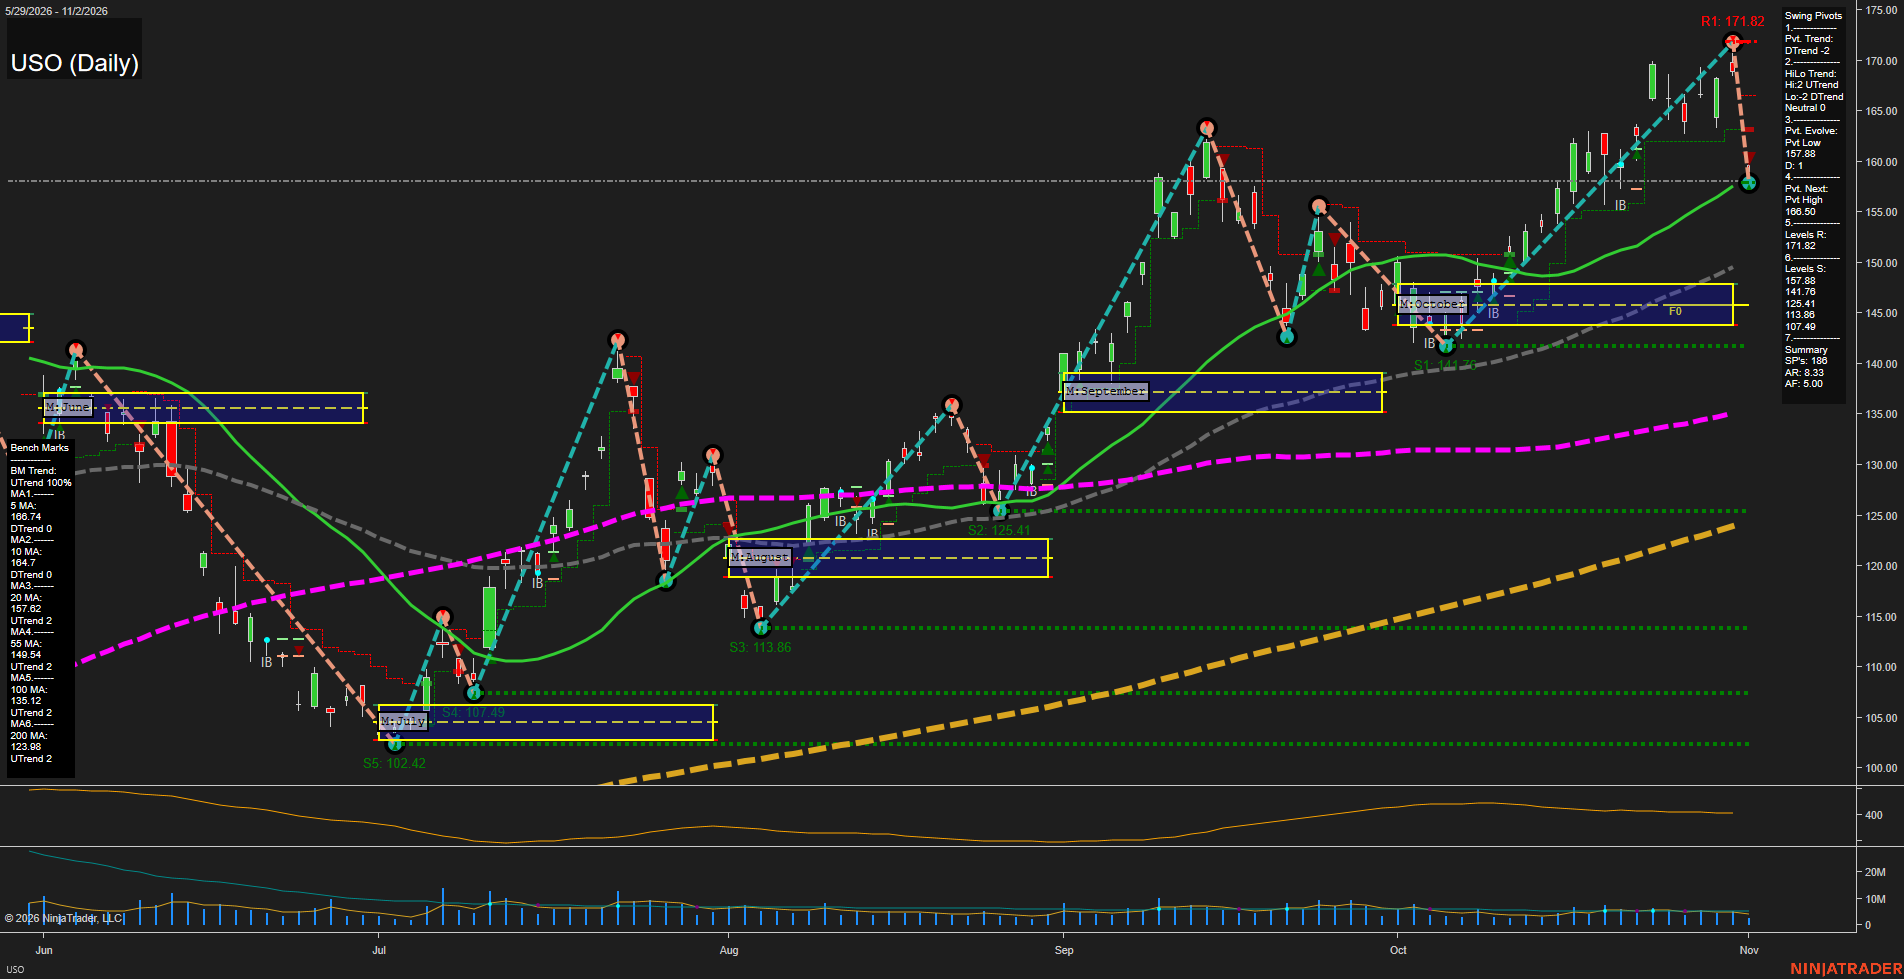
USO United States Oil Fund LP Daily Chart Analysis: 2026-Nov-02 11:15 CT
Price Action
- Last: 158.38,
- Bars: Large,
- Mom: fast.
WSFG Weekly
- Short-Term
- WSFG Current: NA%
- F0%/NTZ' Bias: Price Neutral,
- WSFG Trend: Neutral.
MSFG Month Nov
- Intermediate-Term
- MSFG Current: NA%
- F0%/NTZ' Bias: Price Bullish,
- MSFG Trend: Bullish.
YSFG Year 2026
- Long-Term
- YSFG Current: NA%
- F0%/NTZ' Bias: Price Neutral,
- YSFG Trend: Neutral.
Swing Pivots
- (Short-Term) 1. Pvt. Trend: DTrend,
- (Intermediate-Term) 2. HiLo Trend: UTrend,
- 3. Pvt. Evolve: Pvt low 157.38,
- 4. Pvt. Next: Pvt high 160.59,
- 5. Levels R: 171.82,
- 6. Levels S: 157.38, 141.76, 125.41, 113.86, 107.49, 102.42.
Daily Benchmarks
- (Short-Term) 5 Day: 168.74 Up Trend,
- (Short-Term) 10 Day: 164.70 Down Trend,
- (Intermediate-Term) 20 Day: 157.82 Up Trend,
- (Intermediate-Term) 55 Day: 149.54 Up Trend,
- (Long-Term) 100 Day: 135.62 Up Trend,
- (Long-Term) 200 Day: 123.98 Up Trend.
Additional Metrics
- ATR: 4.00,
- VOLMA: 2577640.
Overall Rating
- Short-Term: Bearish,
- Intermediate-Term: Bullish,
- Long-Term: Bullish.
Key Insights Summary
USO remains within a broad daily uptrend, supported by rising 20-, 55-, 100-, and 200-day benchmarks and an intermediate pivot structure that remains UTrend. The latest large downside bar reversed sharply from the 171.82 swing-high resistance area and shifted the short-term pivot condition to DTrend, with price now below the declining 5- and 10-day averages. The 157.38 pivot low and rising 20-day average form the immediate technical balance area, while 160.59 marks the next pivot reversal threshold. The November monthly grid remains below current price, preserving a bullish intermediate-term location despite the near-term pullback and elevated daily volatility.
Chart Analysis ATS AI Generated: 2026-11-02 11:15 for Informational use only, not trading advice. Terms and Risk Disclosure Copyright © 2026. Algo Trading Systems LLC.