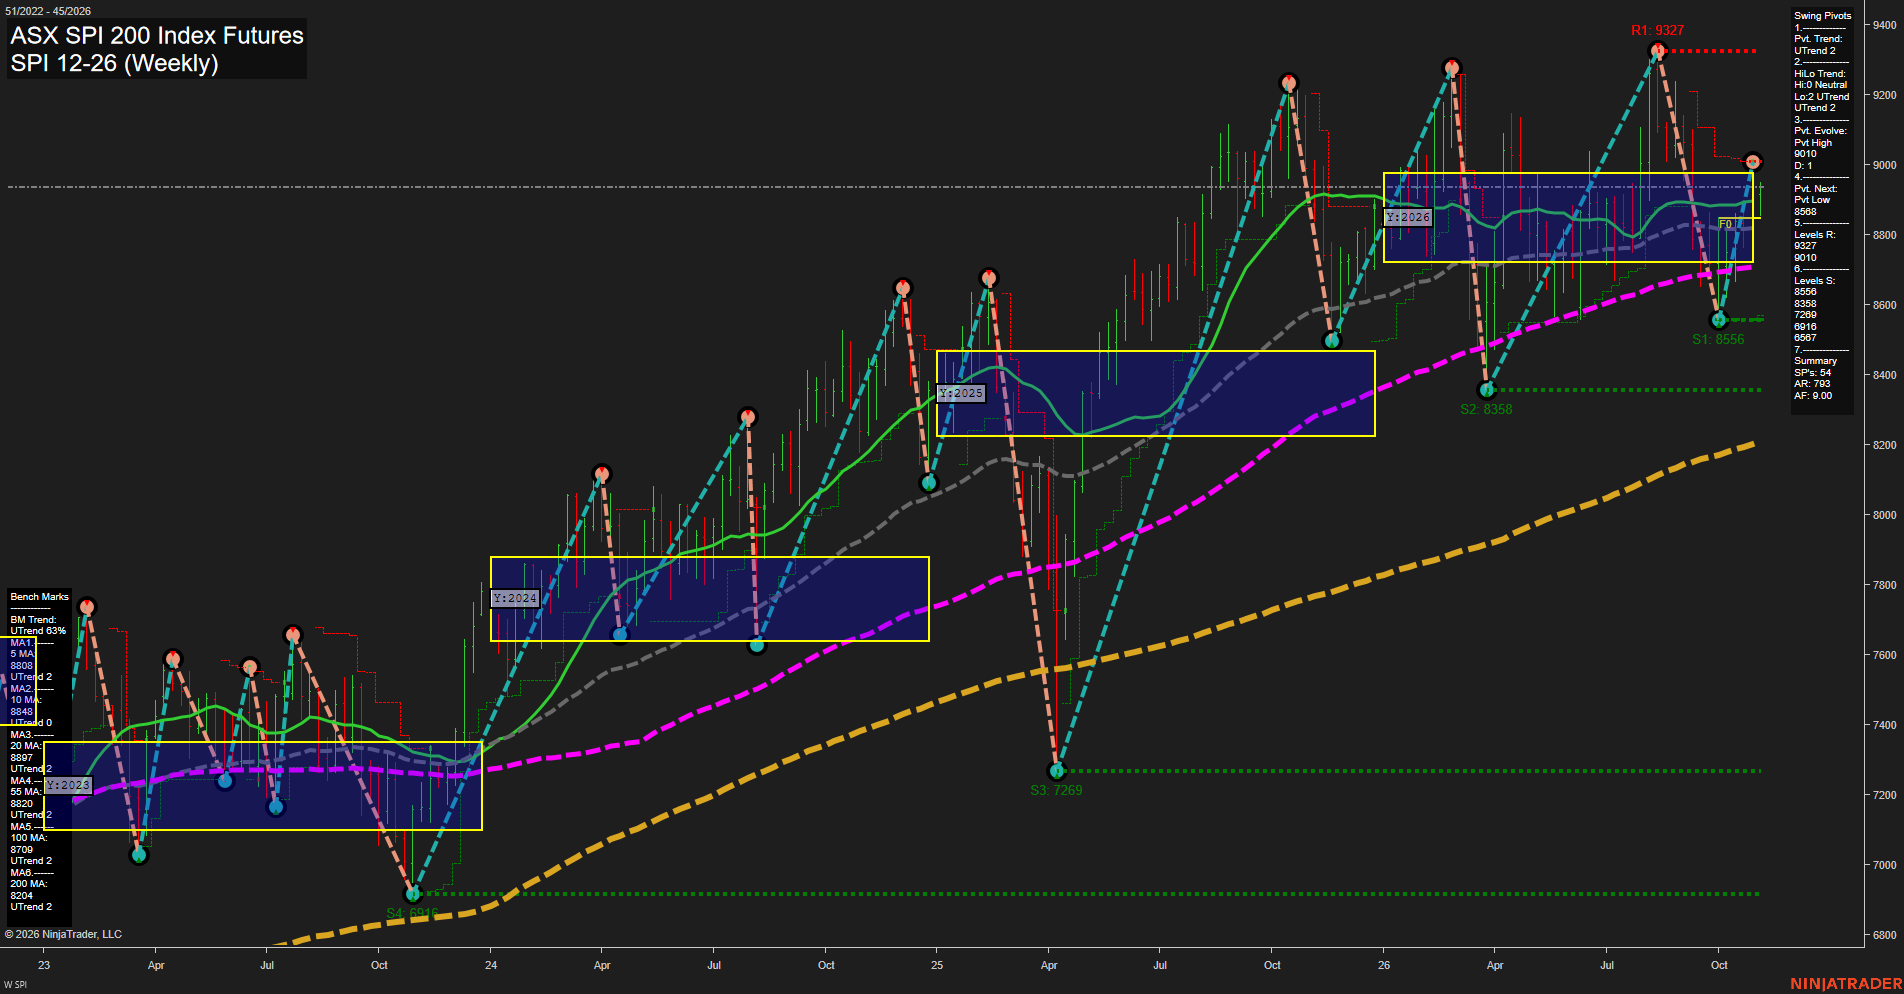
SPI ASX SPI 200 Index Futures Weekly Chart Analysis: 2026-Nov-02 11:13 CT
Price Action
- Last: 8900,
- Bars: Medium,
- Mom: Fast.
WSFG Weekly
- Short-Term
- WSFG Current: NA%
- F0%/NTZ' Bias: Price Bullish,
- WSFG Trend: Bullish.
MSFG Month Nov
- Intermediate-Term
- MSFG Current: NA%
- F0%/NTZ' Bias: Price Bullish,
- MSFG Trend: Bullish.
YSFG Year 2026
- Long-Term
- YSFG Current: NA%
- F0%/NTZ' Bias: Price Bullish,
- YSFG Trend: Bullish.
Swing Pivots
- (Short-Term) 1. Pvt. Trend: UTrend,
- (Intermediate-Term) 2. HiLo Trend: Neutral,
- 3. Pvt. Evolve: Pvt high 9000,
- 4. Pvt. Next: Pvt low 8568,
- 5. Levels R: 9327, 9010,
- 6. Levels S: 8556, 8358, 7269, 6916, 6567.
Weekly Benchmarks
- (Short-Term) 5 Day: 8808 Up Trend,
- (Short-Term) 10 Day: 8848 Up Trend,
- (Intermediate-Term) 20 Day: 8897 Up Trend,
- (Intermediate-Term) 55 Day: 8820 Up Trend,
- (Long-Term) 100 Day: 8709 Up Trend,
- (Long-Term) 200 Day: 8204 Up Trend.
Overall Rating
- Short-Term: Bullish,
- Intermediate-Term: Bullish,
- Long-Term: Bullish.
Key Insights Summary
The weekly structure shows a fast V-shaped recovery from the 8556 swing support and a renewed short-term pivot uptrend. Price is trading above the rising 5, 10, 55, 100, and 200-period benchmarks, while the 20-period benchmark near 8897 is being closely tested. The advance has returned price to the 9010 resistance area beneath the major 9327 pivot high, leaving the intermediate pivot structure neutral despite the broadly rising benchmark alignment. The 8568/8556 area defines the nearest swing support zone, followed by 8358, while a sustained recovery through 9010 would place the 9327 high back in focus. The yearly grid position remains constructive above its central region, with the current market characterised by elevated weekly volatility and a strong counter-swing recovery within the larger uptrend.
Chart Analysis ATS AI Generated: 2026-11-02 11:14 for Informational use only, not trading advice. Terms and Risk Disclosure Copyright © 2026. Algo Trading Systems LLC.