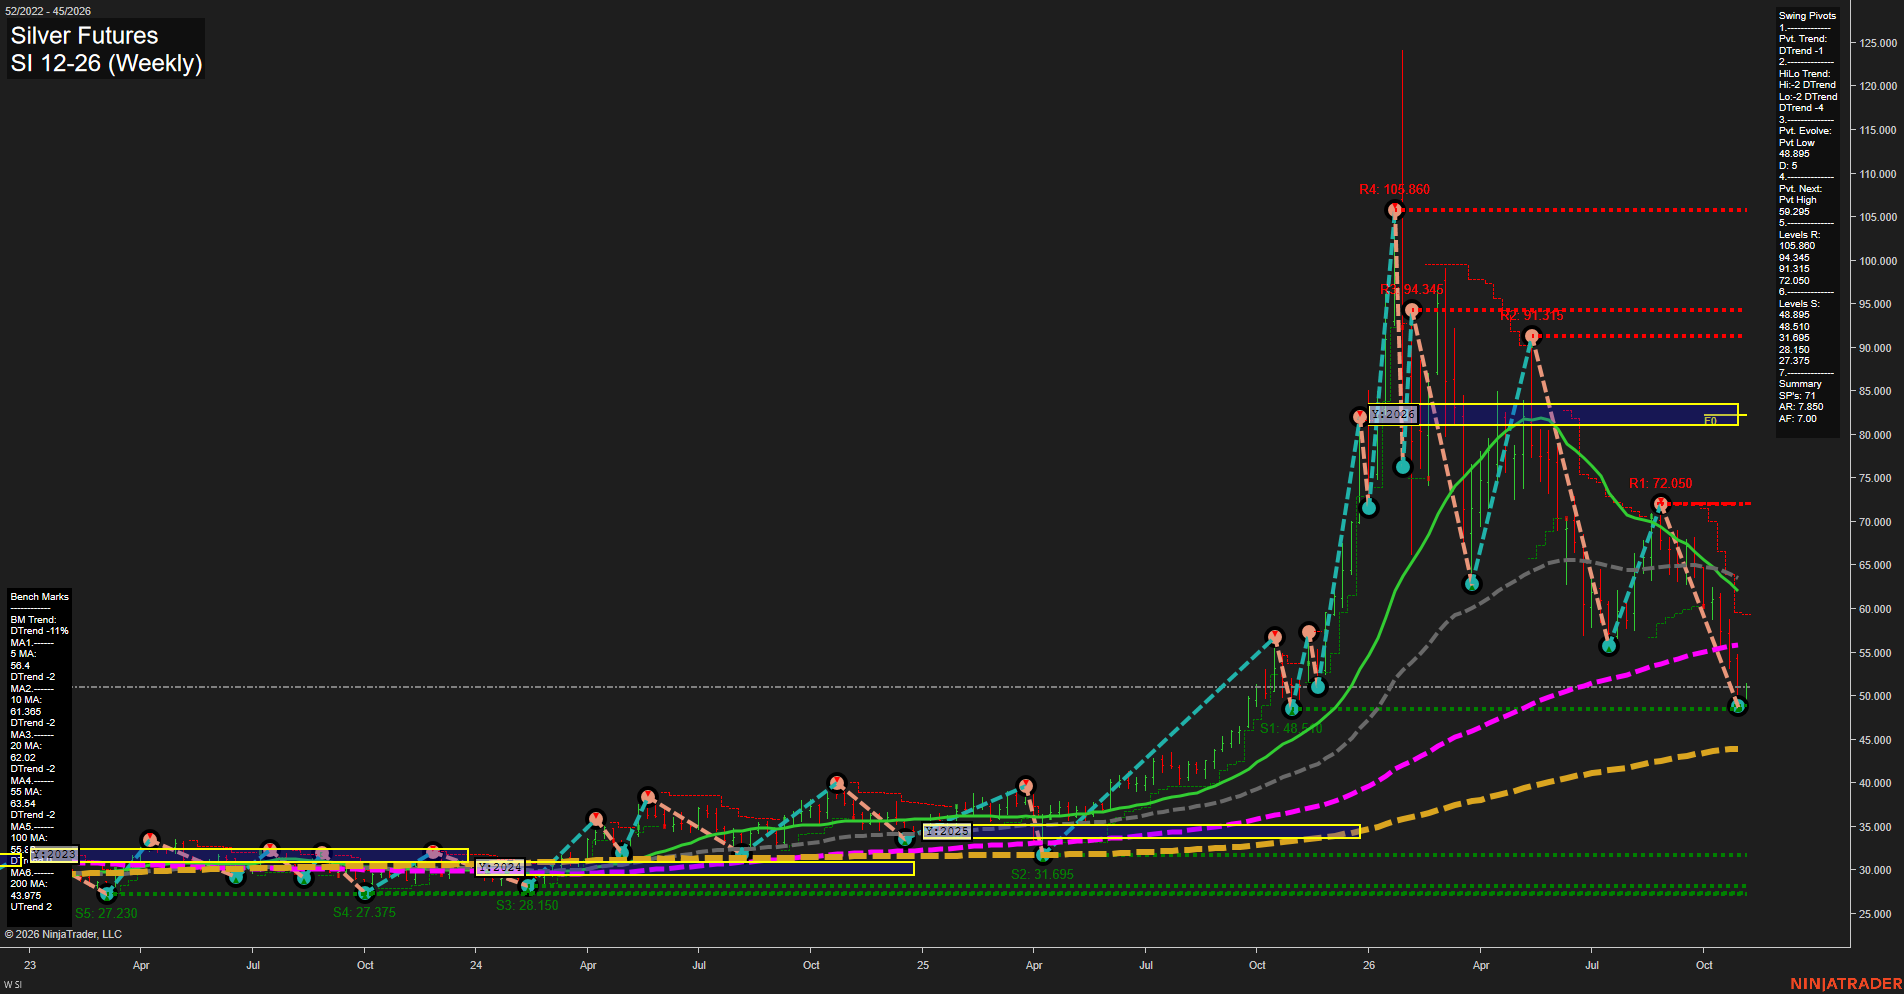
SI Silver Futures Weekly Chart Analysis: 2026-Nov-02 11:12 CT
Price Action
- Last: 50.105,
- Bars: Medium,
- Mom: Fast.
WSFG Weekly
- Short-Term
- WSFG Current: 33%
- F0%/NTZ' Bias: Price Above,
- WSFG Trend: Up.
MSFG Month Nov
- Intermediate-Term
- MSFG Current: 15%
- F0%/NTZ' Bias: Price Above,
- MSFG Trend: Up.
YSFG Year 2026
- Long-Term
- YSFG Current: -260%
- F0%/NTZ' Bias: Price Below,
- YSFG Trend: Down.
Swing Pivots
- (Short-Term) 1. Pvt. Trend: DTrend,
- (Intermediate-Term) 2. HiLo Trend: DTrend,
- 3. Pvt. Evolve: Pvt low 48.895,
- 4. Pvt. Next: Pvt high 59.295,
- 5. Levels R: 105.860, 94.345, 91.315, 72.050,
- 6. Levels S: 48.895, 48.510, 31.695, 28.150, 27.375.
Weekly Benchmarks
- (Short-Term) 5 Day: 56.400 Down Trend,
- (Short-Term) 10 Day: 61.385 Down Trend,
- (Intermediate-Term) 20 Day: 62.025 Down Trend,
- (Intermediate-Term) 55 Day: 63.540 Down Trend,
- (Long-Term) 100 Day: 55.900 Up Trend,
- (Long-Term) 200 Day: 43.875 Up Trend.
Recent Trade Signals
- 02 Nov 2026: Long SI 12-26 @ 51.055 Signals.USAR-MSFG
- 28 Oct 2026: Short SI 12-26 @ 53.585 Signals.USAR-WSFG
Overall Rating
- Short-Term: Bearish,
- Intermediate-Term: Bearish,
- Long-Term: Bullish.
Key Insights Summary
Silver remains in a sharp corrective swing after the earlier vertical advance, with lower pivot highs and a fresh 48.895 pivot low defining the active short-term structure. Price is below the declining 5, 10, 20, and 55-week benchmarks, while the bounce from the 48.510-48.895 support band reflects an oversold countertrend recovery. The monthly grid remains positive, but the yearly grid is decisively below its F0% level; longer-cycle strength is retained by the rising 100- and 200-week averages. A sustained recovery above 59.295 would alter the immediate pivot sequence, while 48.895 remains the key near-term structural floor.
Chart Analysis ATS AI Generated: 2026-11-02 11:13 for Informational use only, not trading advice. Terms and Risk Disclosure Copyright © 2026. Algo Trading Systems LLC.