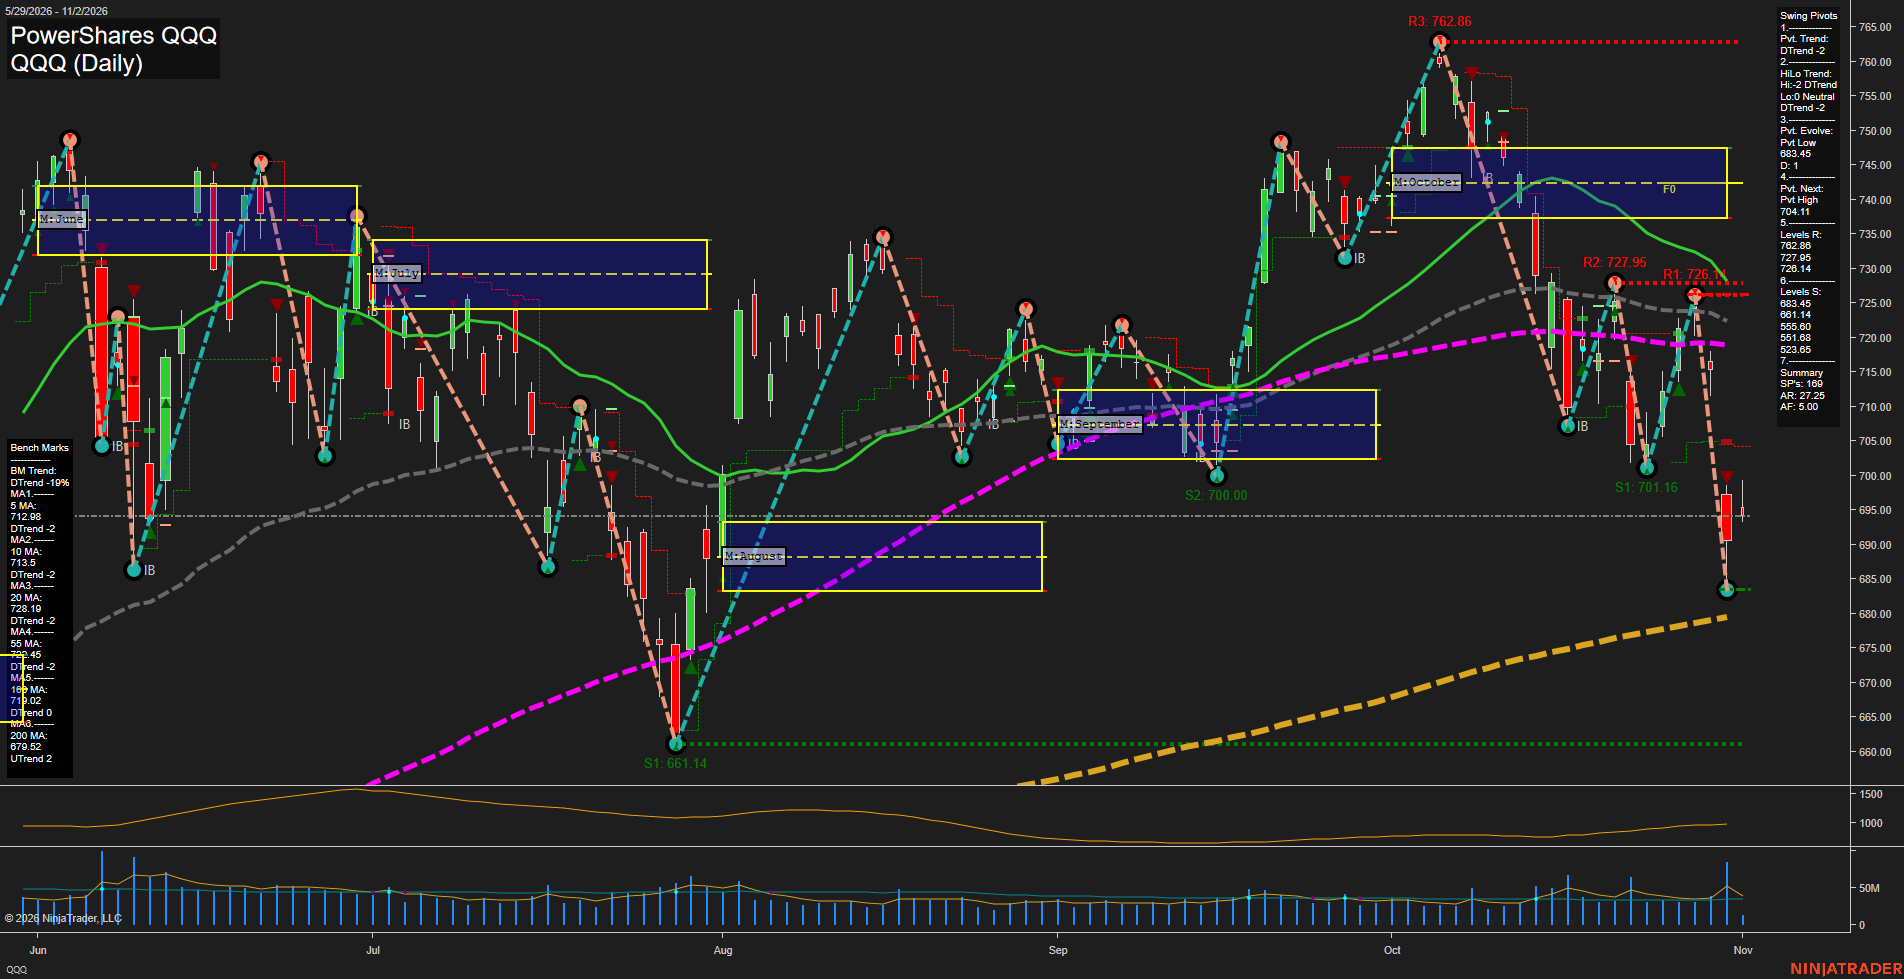
QQQ PowerShares QQQ Daily Chart Analysis: 2026-Nov-02 11:11 CT
Price Action
- Last: 693.45,
- Bars: Large,
- Mom: fast.
WSFG Weekly
- Short-Term
- WSFG Current: NA%
- F0%/NTZ' Bias: Price Neutral,
- WSFG Trend: Neutral.
MSFG Month Nov
- Intermediate-Term
- MSFG Current: NA%
- F0%/NTZ' Bias: Price Neutral,
- MSFG Trend: Neutral.
YSFG Year 2026
- Long-Term
- YSFG Current: NA%
- F0%/NTZ' Bias: Price Neutral,
- YSFG Trend: Neutral.
Swing Pivots
- (Short-Term) 1. Pvt. Trend: DTrend,
- (Intermediate-Term) 2. HiLo Trend: DTrend,
- 3. Pvt. Evolve: Pvt low 683.45,
- 4. Pvt. Next: Pvt high 704.11,
- 5. Levels R: 762.86, 727.95, 726.14,
- 6. Levels S: 683.45, 661.14, 655.60, 551.68, 523.65.
Daily Benchmarks
- (Short-Term) 5 Day: 712.98 Down Trend,
- (Short-Term) 10 Day: 713.50 Down Trend,
- (Intermediate-Term) 20 Day: 728.49 Down Trend,
- (Intermediate-Term) 55 Day: 722.45 Down Trend,
- (Long-Term) 100 Day: 718.02 Down Trend,
- (Long-Term) 200 Day: 679.52 Up Trend.
Additional Metrics
- ATR: 27.25,
- VOLMA: 32709273.
Overall Rating
- Short-Term: Bearish,
- Intermediate-Term: Bearish,
- Long-Term: Neutral.
Key Insights Summary
QQQ futures-equivalent swing structure is decisively lower across the short and intermediate horizons: price is beneath the declining 5, 10, 20, 55, and 100-day benchmarks, while the pivot sequence remains DTrend with lower highs and a fresh 683.45 pivot low. The rapid decline from the 726-728 resistance cluster has expanded daily range and momentum, with 704.11 defining the nearest opposing pivot level. The 683.45 area is the immediate structural reference, followed by 661.14 support; the still-rising 200-day average near 679.52 preserves a neutral longer-cycle backdrop despite the current corrective downswing.
Chart Analysis ATS AI Generated: 2026-11-02 11:11 for Informational use only, not trading advice. Terms and Risk Disclosure Copyright © 2026. Algo Trading Systems LLC.