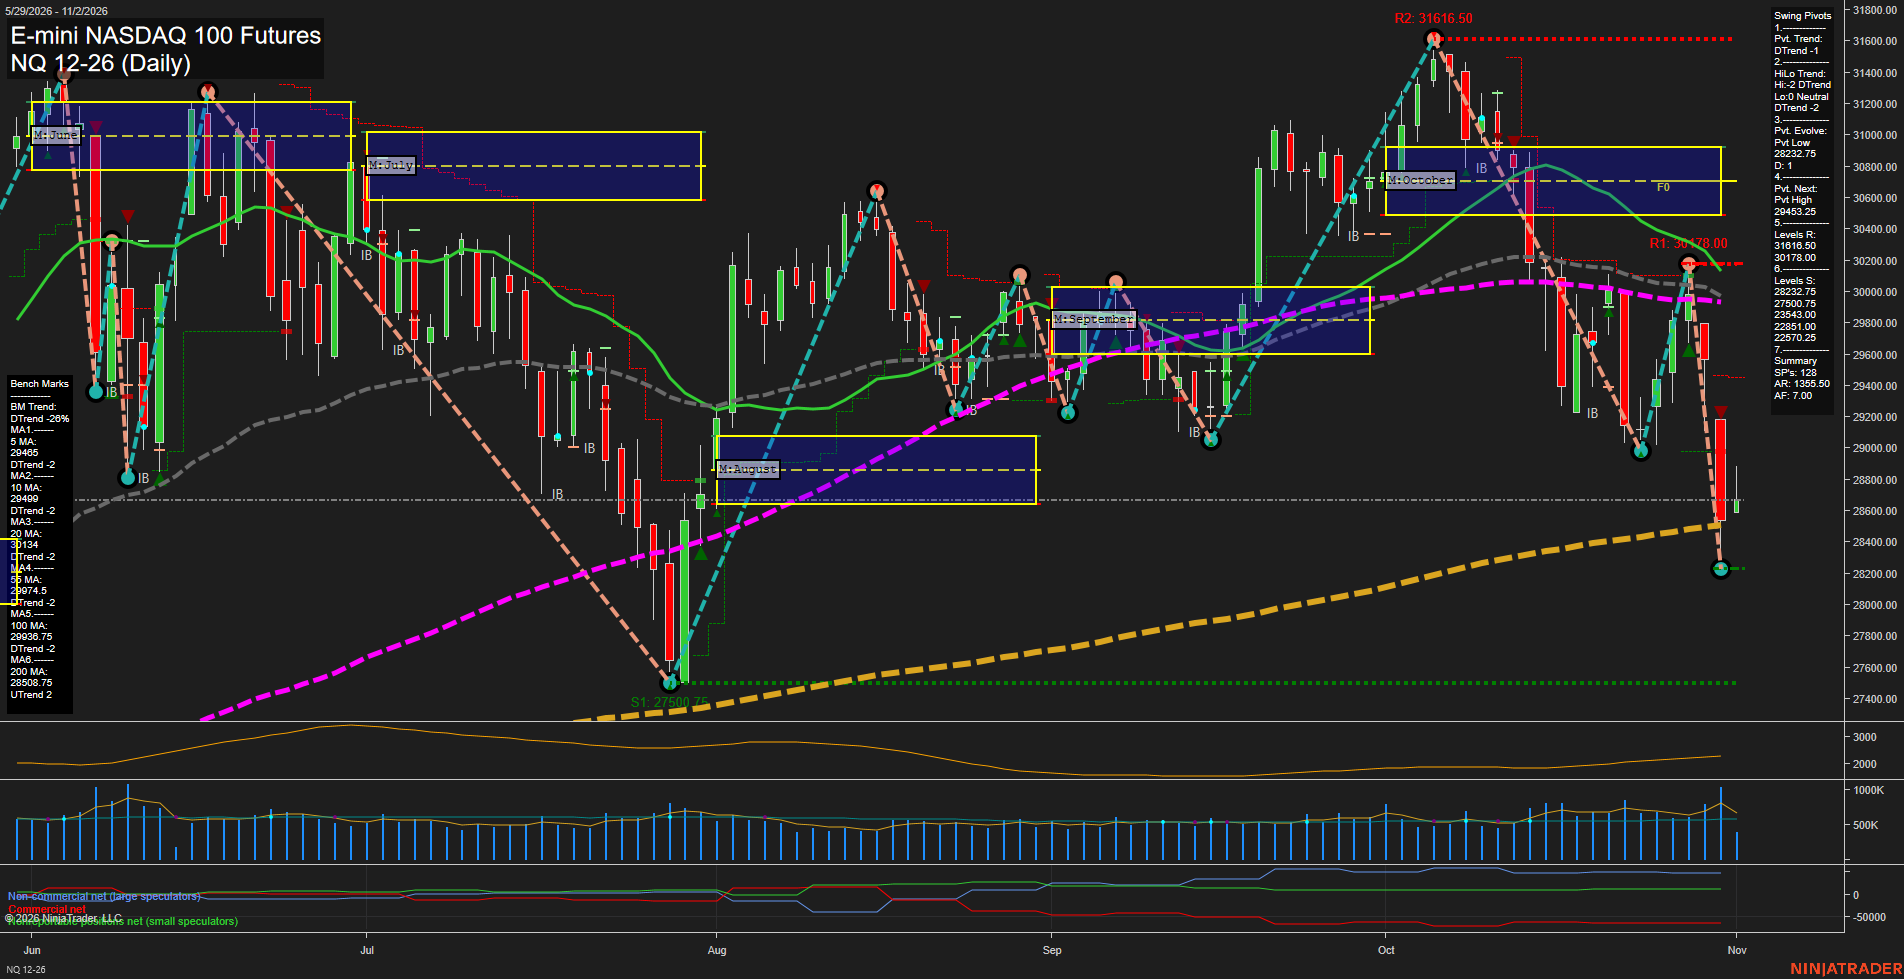
NQ E-mini NASDAQ 100 Futures Daily Chart Analysis: 2026-Nov-02 11:10 CT
Price Action
- Last: 28612.00,
- Bars: Large,
- Mom: Fast.
WSFG Weekly
- Short-Term
- WSFG Current: 6%
- F0%/NTZ' Bias: Price Above,
- WSFG Trend: Up.
MSFG Month Nov
- Intermediate-Term
- MSFG Current: 3%
- F0%/NTZ' Bias: Price Above,
- MSFG Trend: Up.
YSFG Year 2026
- Long-Term
- YSFG Current: 46%
- F0%/NTZ' Bias: Price Above,
- YSFG Trend: Up.
Swing Pivots
- (Short-Term) 1. Pvt. Trend: DTrend,
- (Intermediate-Term) 2. HiLo Trend: DTrend,
- 3. Pvt. Evolve: Pvt low 28220.75,
- 4. Pvt. Next: Pvt high 29463.25,
- 5. Levels R: 31616.50, 30178.00,
- 6. Levels S: 28232.75, 27500.75, 23543.00, 22851.00, 22570.25.
Daily Benchmarks
- (Short-Term) 5 Day: 29486 Down Trend,
- (Short-Term) 10 Day: 29499 Down Trend,
- (Intermediate-Term) 20 Day: 30131 Down Trend,
- (Intermediate-Term) 55 Day: 29745 Down Trend,
- (Long-Term) 100 Day: 29936.75 Down Trend,
- (Long-Term) 200 Day: 28508.75 Up Trend.
Additional Metrics
- ATR: 1618,
- VOLMA: 626746.
Recent Trade Signals
- 30 Oct 2026: Short NQ 12-26 @ 28940.5 Signals.USAR-WSFG
- 27 Oct 2026: Long NQ 12-26 @ 29575.5 Signals.USAR.TR120
Overall Rating
- Short-Term: Bearish,
- Intermediate-Term: Bearish,
- Long-Term: Bullish.
Key Insights Summary
Price action has shifted into a fast, large-range downswing, with the active short-term pivot trend and intermediate HiLo structure both in DTrend. The decline has pushed price beneath the 5, 10, 20, 55, and 100-day benchmarks, confirming broad downside alignment across the short and intermediate horizons. The 28220.75 pivot low and nearby 28232.75 support define the current downswing floor, while 29463.25 is the reversal threshold for a new short-term pivot high. The 200-day average remains upward sloping and sits near current price, preserving a constructive longer-term backdrop despite the sharp countertrend liquidation from the October high.
Chart Analysis ATS AI Generated: 2026-11-02 11:10 for Informational use only, not trading advice. Terms and Risk Disclosure Copyright © 2026. Algo Trading Systems LLC.