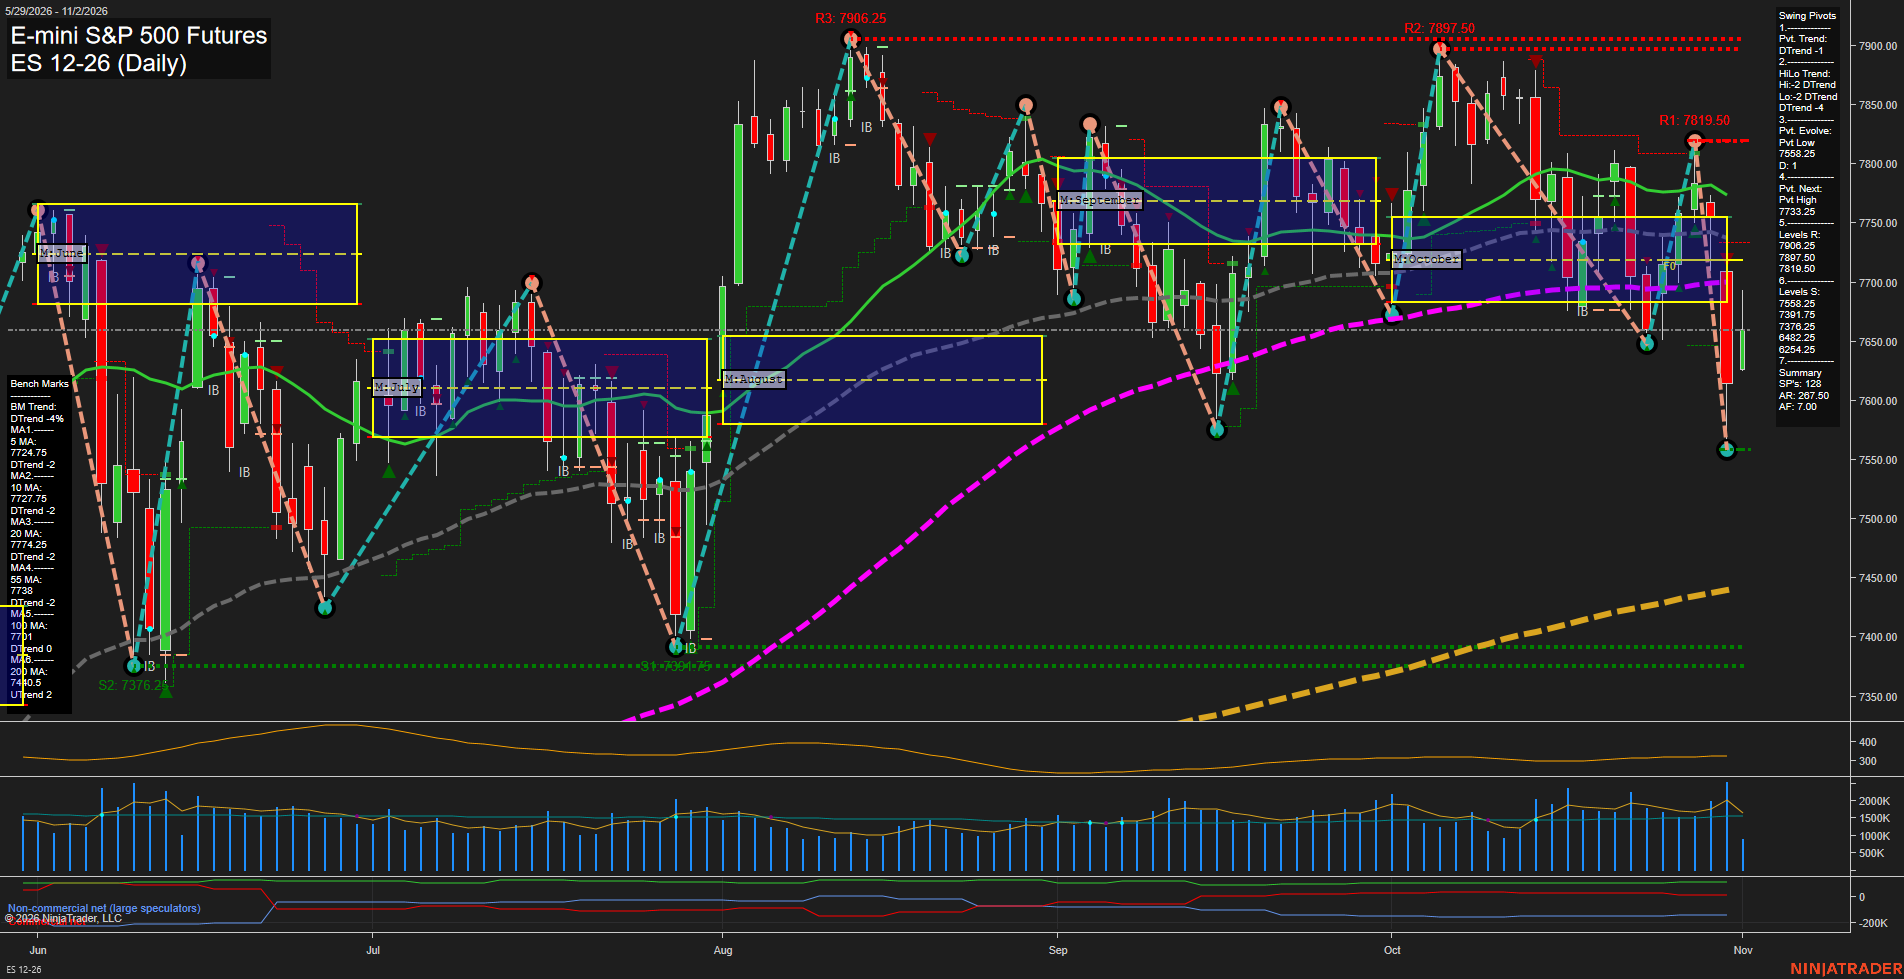
ES E-mini S&P 500 Futures Daily Chart Analysis: 2026-Nov-02 11:05 CT
Price Action
- Last: 7656.25,
- Bars: Large,
- Mom: fast.
WSFG Weekly
- Short-Term
- WSFG Current: 15%
- F0%/NTZ' Bias: Price Above,
- WSFG Trend: Up.
MSFG Month Nov
- Intermediate-Term
- MSFG Current: 10%
- F0%/NTZ' Bias: Price Above,
- MSFG Trend: Up.
YSFG Year 2026
- Long-Term
- YSFG Current: 49%
- F0%/NTZ' Bias: Price Above,
- YSFG Trend: Up.
Swing Pivots
- (Short-Term) 1. Pvt. Trend: DTrend,
- (Intermediate-Term) 2. HiLo Trend: DTrend,
- 3. Pvt. Evolve: Pvt low 7558.25,
- 4. Pvt. Next: Pvt high 7733.25,
- 5. Levels R: 7906.25, 7897.50, 7819.50,
- 6. Levels S: 7558.25, 7391.75, 7376.25, 6482.25.
Daily Benchmarks
- (Short-Term) 5 Day: 7724.75 Down Trend,
- (Short-Term) 10 Day: 7727.75 Down Trend,
- (Intermediate-Term) 20 Day: 7774.25 Down Trend,
- (Intermediate-Term) 55 Day: 7738.00 Down Trend,
- (
Chart Analysis ATS AI Generated: 2026-11-02 11:05 for Informational use only, not trading advice. Terms and Risk Disclosure Copyright © 2026. Algo Trading Systems LLC.