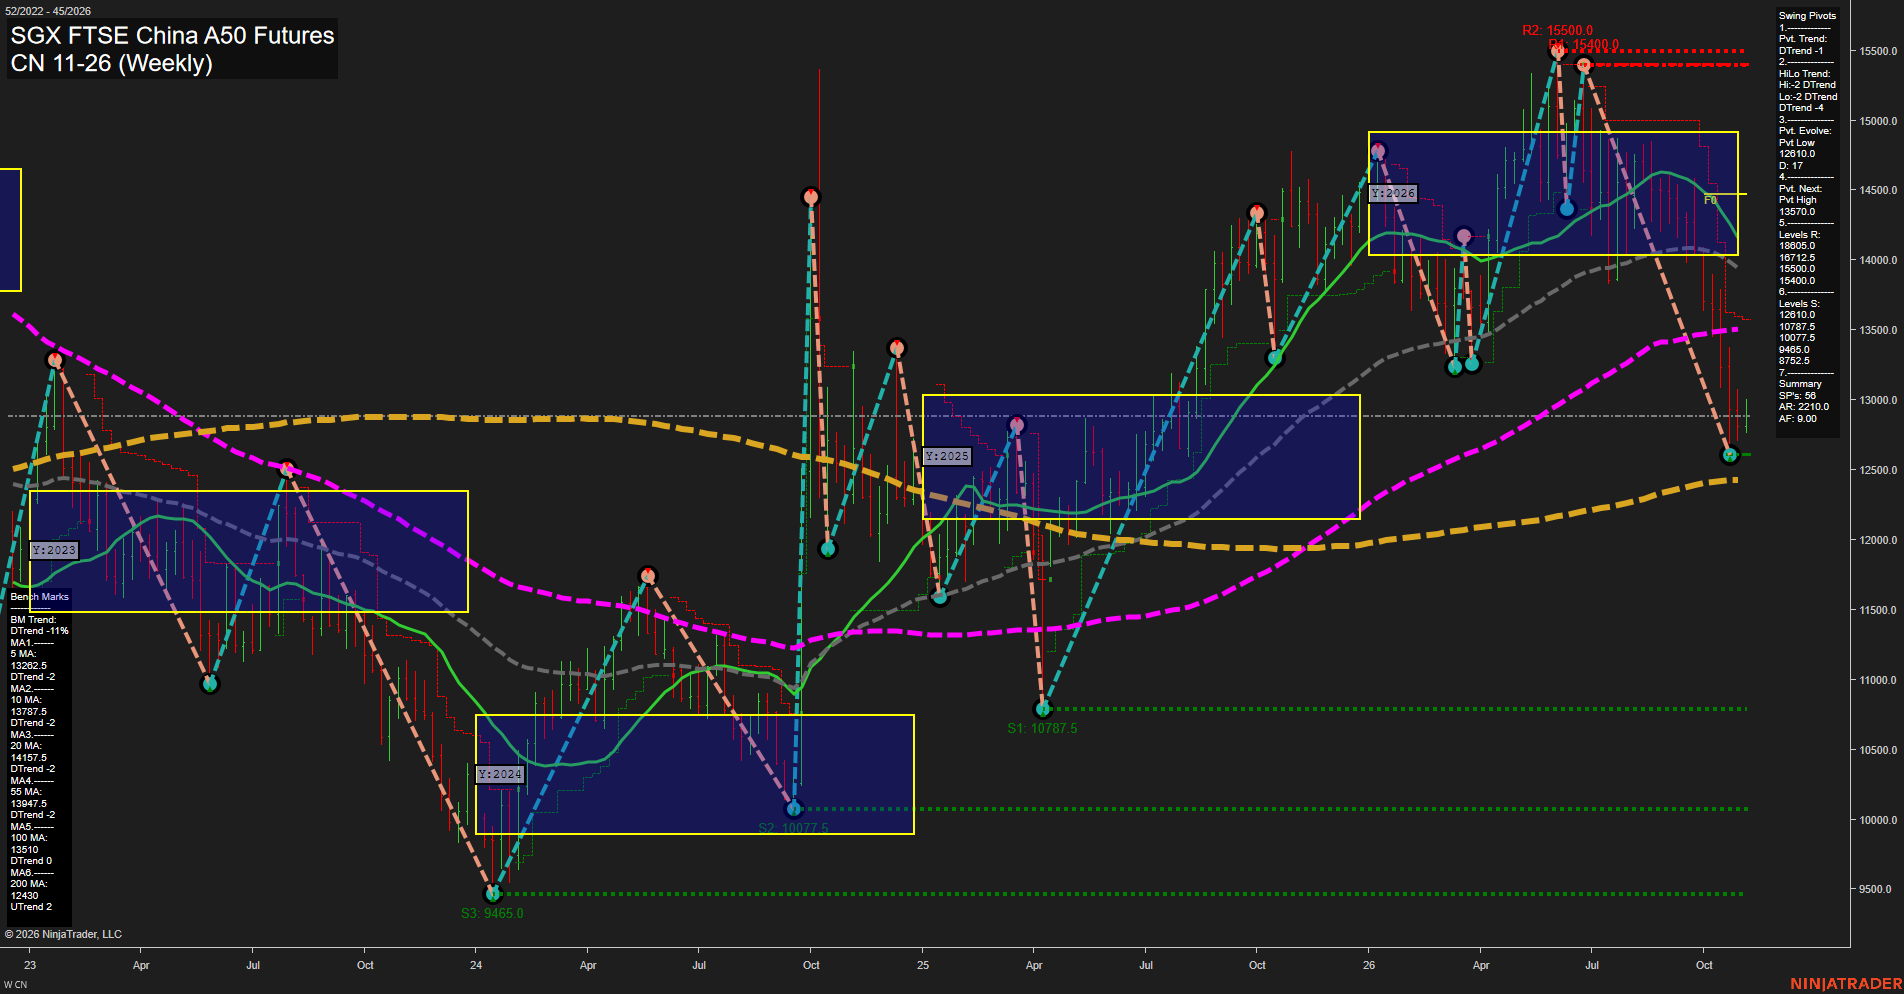
CN SGX FTSE China A50 Futures Weekly Chart Analysis: 2026-Nov-02 11:04 CT
Price Action
- Last: 12810.0,
- Bars: Large,
- Mom: Momentum fast.
WSFG Weekly
- Short-Term
- WSFG Current: NA%
- F0%/NTZ' Bias: Price Bearish,
- WSFG Trend: DTrend.
MSFG Month Nov
- Intermediate-Term
- MSFG Current: NA%
- F0%/NTZ' Bias: Price Bearish,
- MSFG Trend: DTrend.
YSFG Year 2026
- Long-Term
- YSFG Current: NA%
- F0%/NTZ' Bias: Price Bearish,
- YSFG Trend: DTrend.
Swing Pivots
- (Short-Term) 1. Pvt. Trend: DTrend,
- (Intermediate-Term) 2. HiLo Trend: DTrend,
- 3. Pvt. Evolve: Pvt Low 12610.0,
- 4. Pvt. Next: Pvt High 13570.9,
- 5. Levels R: 18850.0, 16712.5, 15500.0, 15400.0,
- 6. Levels S: 12810.0, 10787.5, 10077.5, 9465.0.
Weekly Benchmarks
- (Short-Term) 5 Day: 13266.5 Down Trend,
- (Short-Term) 10 Day: 13787.5 Down Trend,
- (Intermediate-Term) 20 Day: 14157.5 Down Trend,
- (Intermediate-Term) 55 Day: 13947.5 Down Trend,
- (Long-Term) 100 Day: 13510.0 Down Trend,
- (Long-Term) 200 Day: 12430.0 Up Trend.
Overall Rating
- Short-Term: Bearish,
- Intermediate-Term: Bearish,
- Long-Term: Neutral.
Key Insights Summary
Price has undergone a fast, high-volatility retracement from the 15400.0-15500.0 pivot-high area and is now testing the 12810.0 support zone near the evolving pivot low at 12610.0. The short and intermediate swing structures remain downward, with price below the 5, 10, 20, 55, and 100-period benchmarks and beneath the 2026 NTZ/F0% area. The 200-period average remains rising beneath price, preserving a longer-cycle underpinning despite the present corrective decline. A recovery through 13570.9 would establish the next opposing pivot-high threshold, while continuation beneath the current support zone keeps the larger pullback structure directed toward the lower support sequence.
Chart Analysis ATS AI Generated: 2026-11-02 11:04 for Informational use only, not trading advice. Terms and Risk Disclosure Copyright © 2026. Algo Trading Systems LLC.