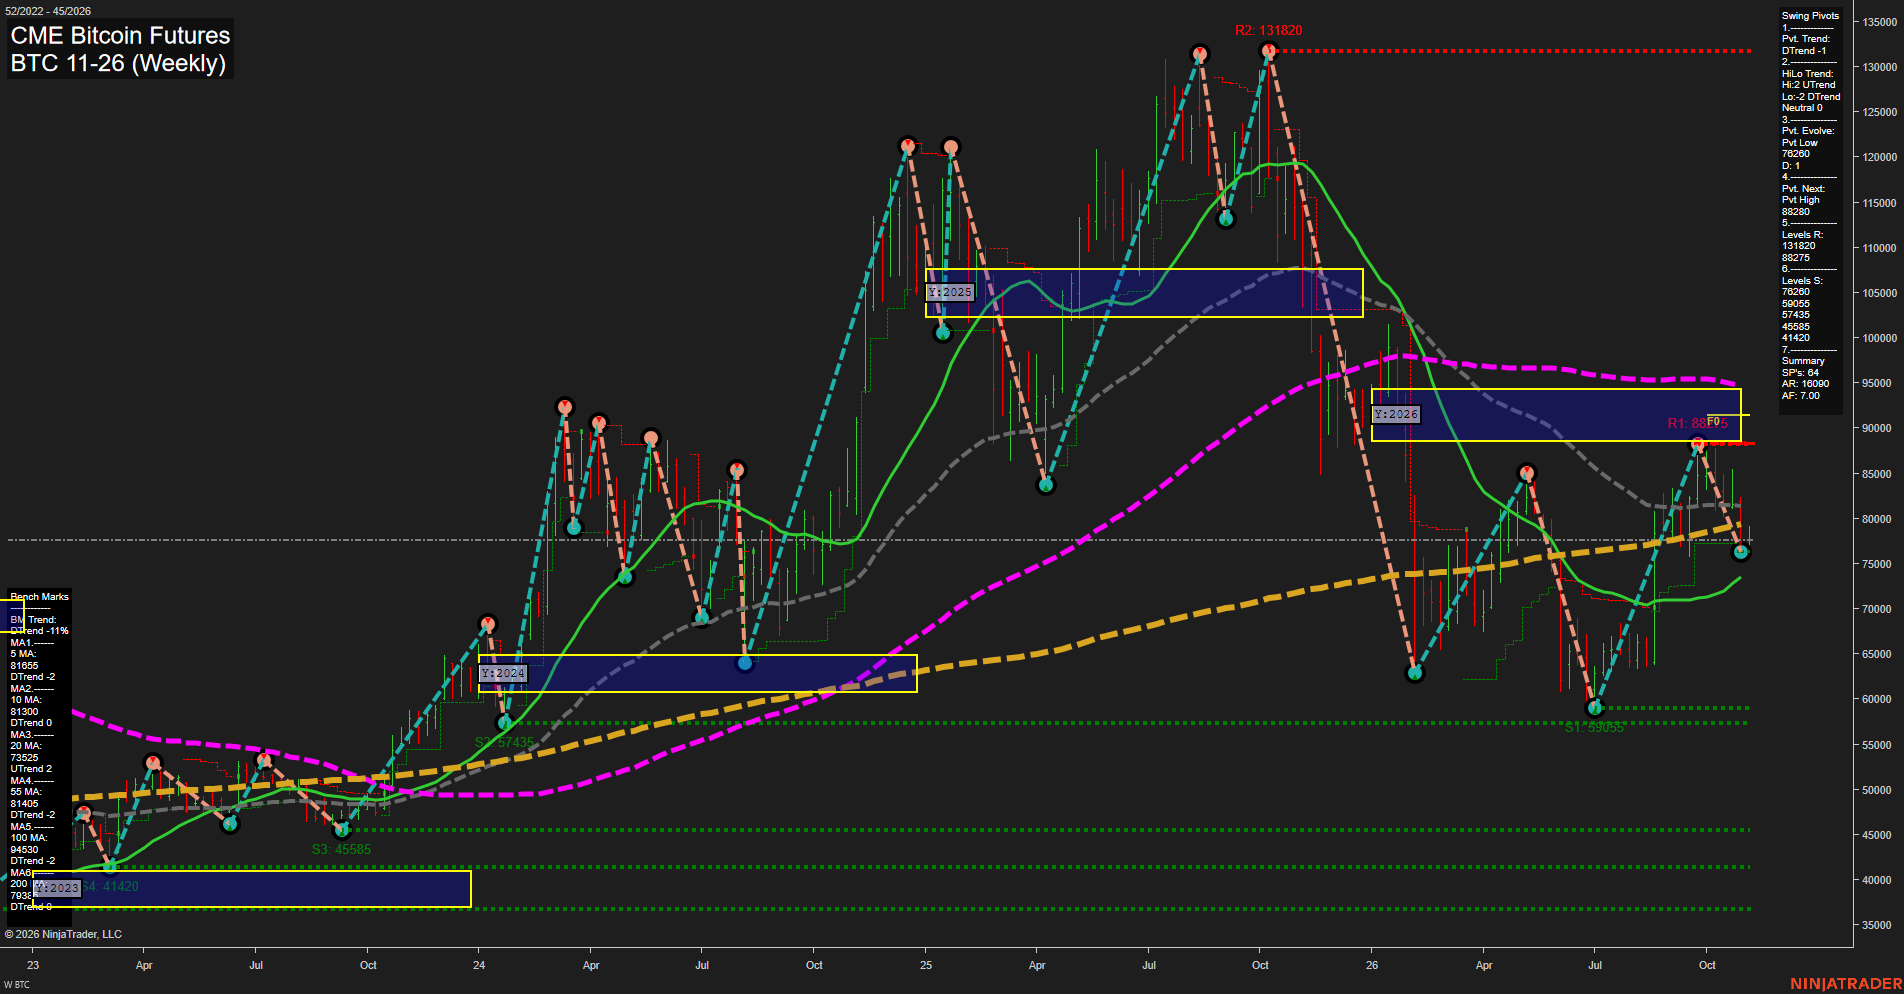
BTC CME Bitcoin Futures Weekly Chart Analysis: 2026-Nov-02 11:03 CT
Price Action
- Last: 78385,
- Bars: Medium,
- Mom: average.
WSFG Weekly
- Short-Term
- WSFG Current: -7%
- F0%/NTZ' Bias: Price Below,
- WSFG Trend: Down.
MSFG Month Nov
- Intermediate-Term
- MSFG Current: -2%
- F0%/NTZ' Bias: Price Below,
- MSFG Trend: Down.
YSFG Year 2026
- Long-Term
- YSFG Current: -48%
- F0%/NTZ' Bias: Price Below,
- YSFG Trend: Down.
Swing Pivots
- (Short-Term) 1. Pvt. Trend: DTrend,
- (Intermediate-Term) 2. HiLo Trend: UTrend,
- 3. Pvt. Evolve: Pvt low 76260,
- 4. Pvt. Next: Pvt high 88280,
- 5. Levels R: 131820, 88275,
- 6. Levels S: 76260, 59055, 57355, 45585, 41420.
Weekly Benchmarks
- (Short-Term) 5 Day: 81155 Down Trend,
- (Short-Term) 10 Day: 81300 Down Trend,
- (Intermediate-Term) 20 Day: 73525 Up Trend,
- (Intermediate-Term) 55 Day: 81405 Down Trend,
- (Long-Term) 100 Day: 94530 Down Trend,
- (Long-Term) 200 Day: 78350 Up Trend.
Recent Trade Signals
- 02 Nov 2026: Long BTC 11-26 @ 78385 Signals.USAR-WSFG
- 29 Oct 2026: Short BTC 11-26 @ 81160 Signals.USAR-MSFG
Overall Rating
- Short-Term: Bearish,
- Intermediate-Term: Bearish,
- Long-Term: Bearish.
Key Insights Summary
BTC futures remain in a broad corrective phase, with price below the weekly, monthly, and yearly Fib-grid reference areas. The short-term pivot structure is bearish after rejection from 88275-88280, while the developing 76260 pivot low defines the current downside swing. Price is holding near the rising 200-period benchmark and above the 20-period benchmark, creating a counter-trend stabilization zone, but the declining 5, 10, 55, and 100-period benchmarks maintain overhead pressure. The intermediate HiLo structure remains UTrend, yet the current price sequence is characterized by lower highs beneath 88275 and volatile retracement behavior within the larger downtrend.
Chart Analysis ATS AI Generated: 2026-11-02 11:03 for Informational use only, not trading advice. Terms and Risk Disclosure Copyright © 2026. Algo Trading Systems LLC.