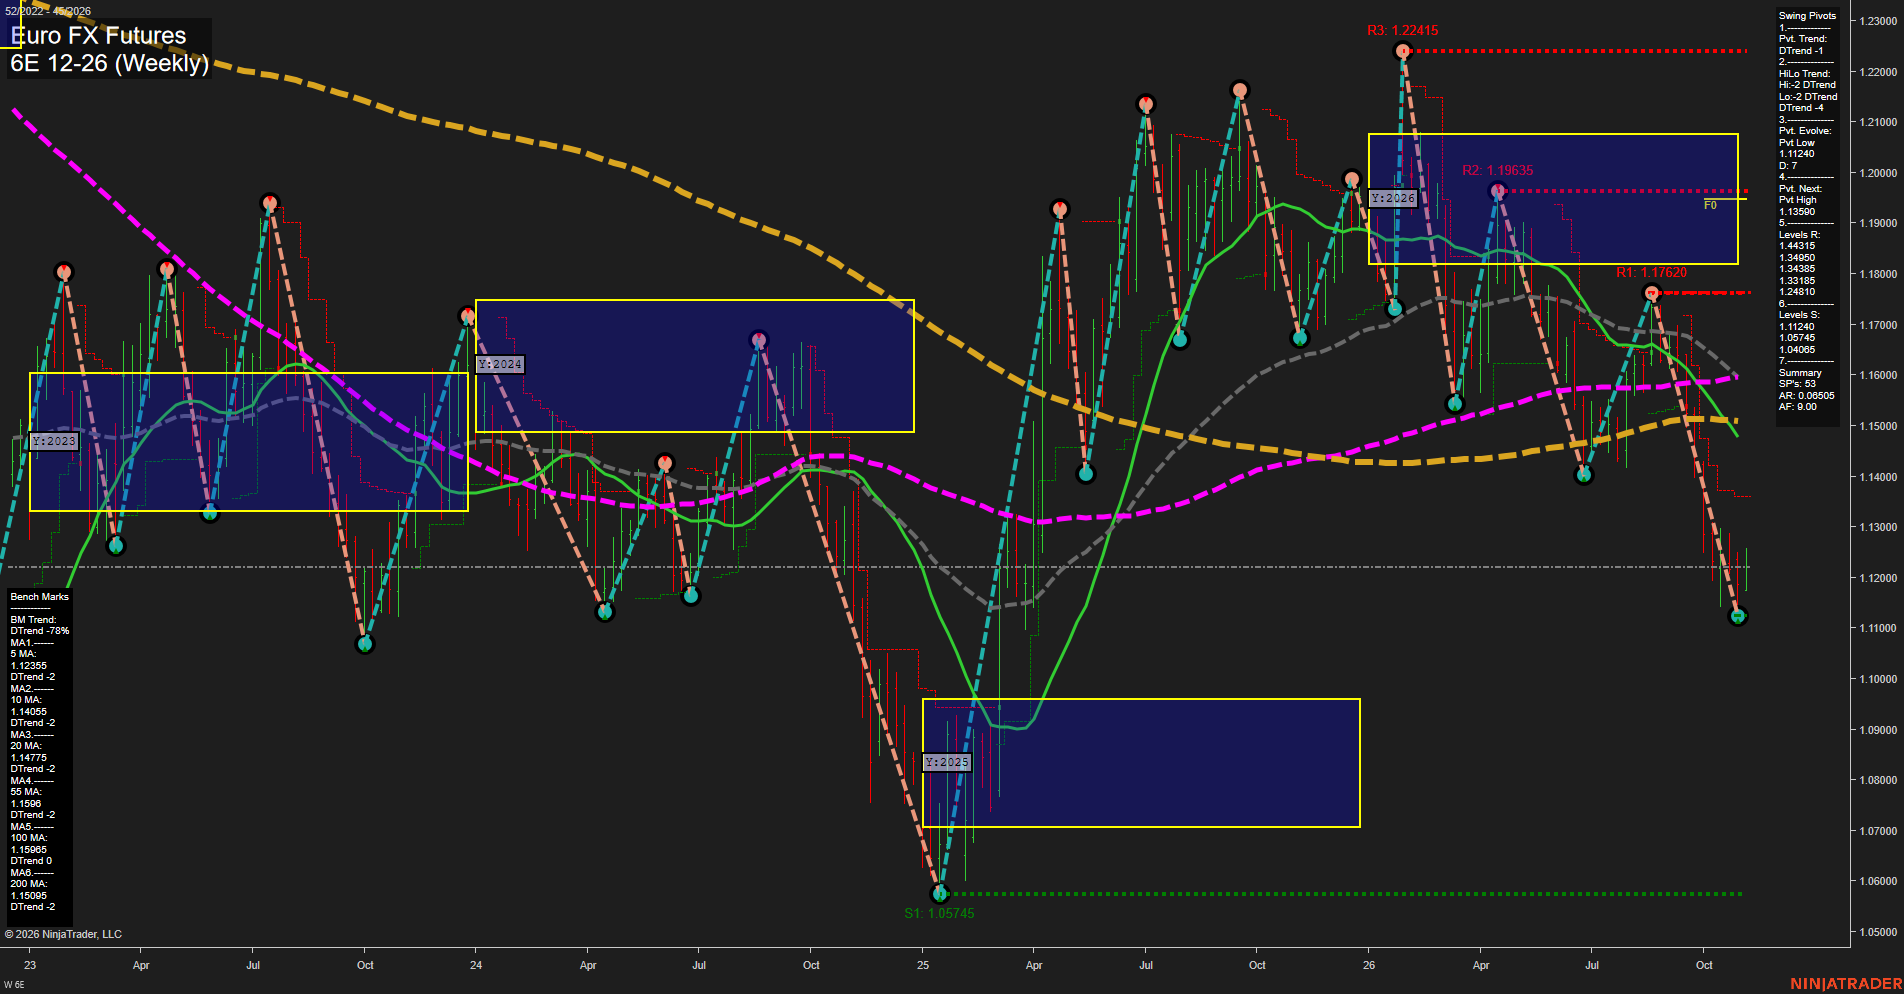
6E Euro FX Futures Weekly Chart Analysis: 2026-Nov-02 11:02 CT
Price Action
- Last: 1.12355,
- Bars: Medium,
- Mom: fast.
WSFG Weekly
- Short-Term
- WSFG Current: 41%
- F0%/NTZ' Bias: Price Above,
- WSFG Trend: Up.
MSFG Month Nov
- Intermediate-Term
- MSFG Current: 20%
- F0%/NTZ' Bias: Price Above,
- MSFG Trend: Up.
YSFG Year 2026
- Long-Term
- YSFG Current: -56%
- F0%/NTZ' Bias: Price Below,
- YSFG Trend: Down.
Swing Pivots
- (Short-Term) 1. Pvt. Trend: DTrend,
- (Intermediate-Term) 2. HiLo Trend: DTrend,
- 3. Pvt. Evolve: Pvt low 1.1240,
- 4. Pvt. Next: Pvt high 1.13590,
- 5. Levels R: 1.19315, 1.18495, 1.18385, 1.17620,
- 6. Levels S: 1.1240, 1.07545, 1.04085.
Weekly Benchmarks
- (Short-Term) 5 Day: 1.12355 Down Trend,
- (Short-Term) 10 Day: 1.14055 Down Trend,
- (Intermediate-Term) 20 Day: 1.14775 Down Trend,
- (Intermediate-Term) 55 Day: 1.15960 Down Trend,
- (Long-Term) 100 Day: 1.15965 Down Trend,
- (Long-Term) 200 Day: 1.15095 Down Trend.
Recent Trade Signals
- 02 Nov 2026: Long 6E 12-26 @ 1.12045 Signals.USAR-MSFG
- 27 Oct 2026: Short 6E 12-26 @ 1.1156 Signals.USAR-WSFG
Overall Rating
- Short-Term: Neutral,
- Intermediate-Term: Bearish,
- Long-Term: Bearish.
Key Insights Summary
Price is attempting a rebound from the 1.11 area and has moved above the weekly and monthly Fib-grid centers, but the larger weekly swing structure remains in a DTrend with lower highs and lower lows. The immediate pivot sequence remains bearish until a new pivot high develops above 1.13590. The short-term picture is mixed because the recent MSFG long signal and rebound conflict with the broader pivot and benchmark alignment. All six weekly benchmarks slope lower and remain above price, reinforcing a bearish intermediate-to-long-term trend condition. The 1.1240 area is the nearest swing support, while 1.17620 and the 1.18385 to 1.19315 resistance band define the principal overhead recovery zone. The yearly Fib position remains below its F0% region, characterizing the current bounce as counter-trend within the 2026 downswing.
Chart Analysis ATS AI Generated: 2026-11-02 11:02 for Informational use only, not trading advice. Terms and Risk Disclosure Copyright © 2026. Algo Trading Systems LLC.