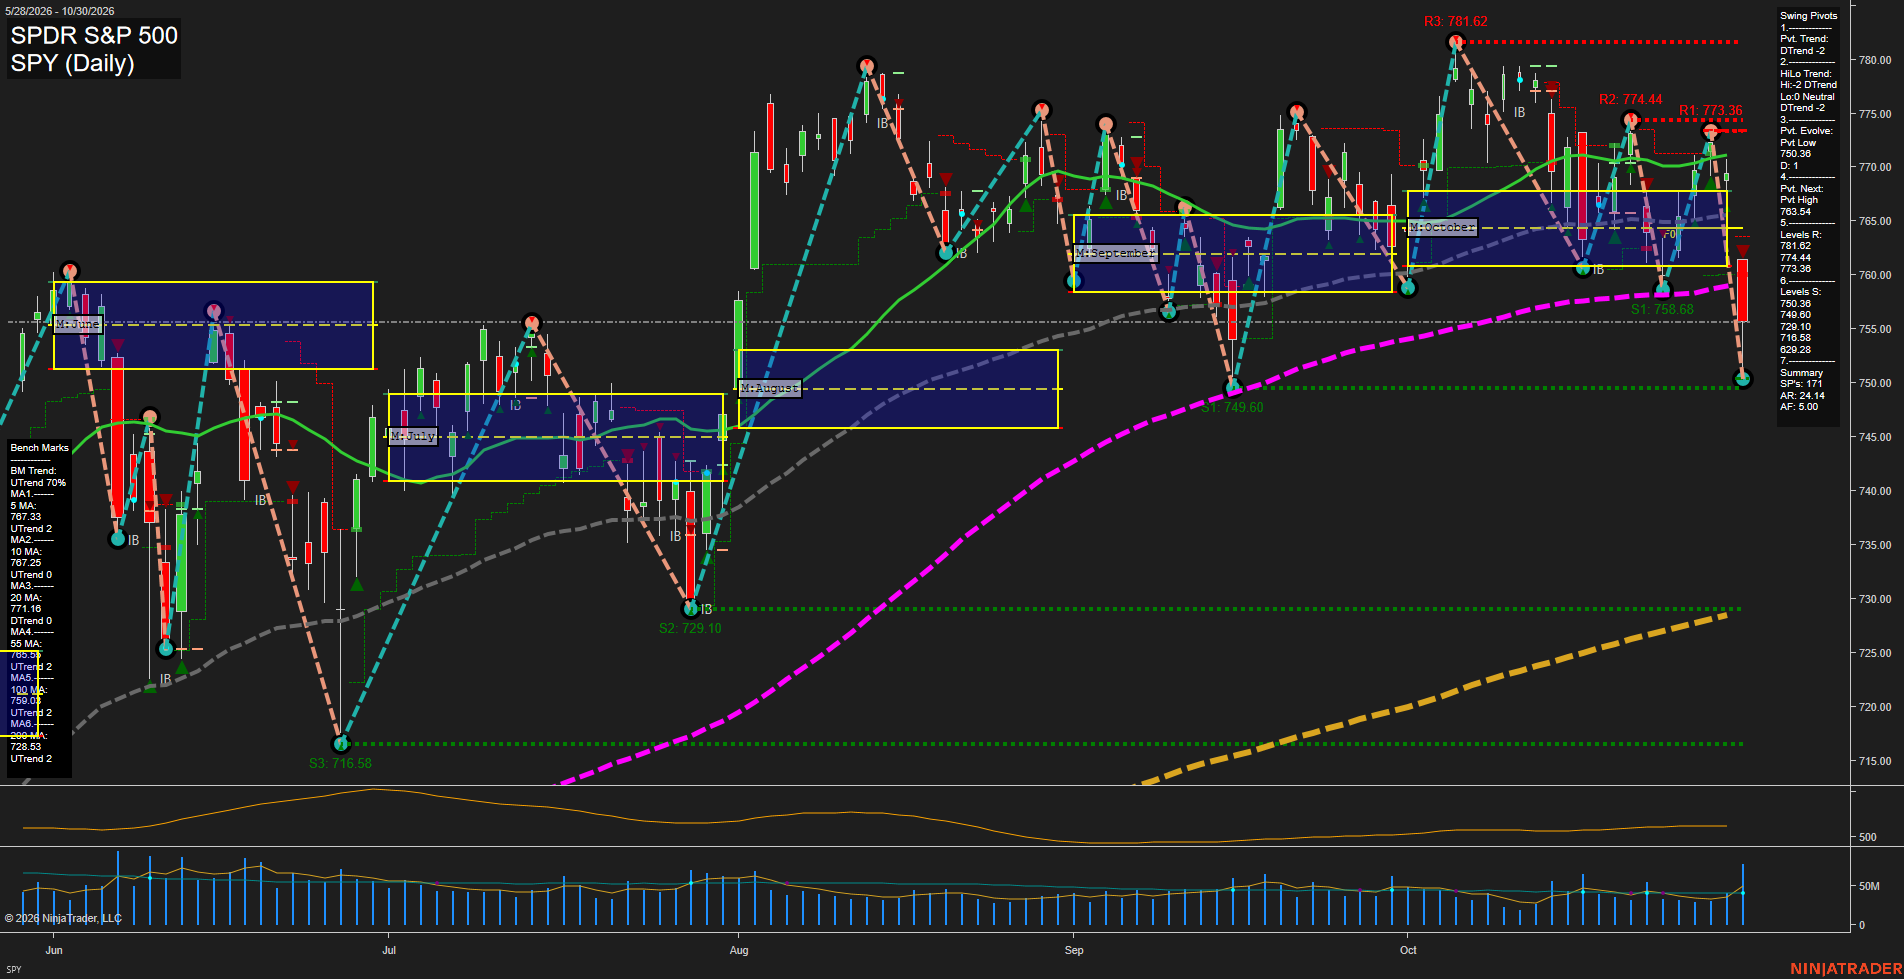
SPY SPDR S&P 500 Daily Chart Analysis: 2026-Oct-31 07:08 CT
Price Action
- Last: 750.36,
- Bars: Large,
- Mom: fast.
WSFG Weekly
- Short-Term
- WSFG Current: NA%
- F0%/NTZ' Bias: Price Bearish,
- WSFG Trend: Bearish.
MSFG Month Oct
- Intermediate-Term
- MSFG Current: NA%
- F0%/NTZ' Bias: Price Bearish,
- MSFG Trend: Bearish.
YSFG Year 2026
- Long-Term
- YSFG Current: NA%
- F0%/NTZ' Bias: Price Bullish,
- YSFG Trend: Bullish.
Swing Pivots
- (Short-Term) 1. Pvt. Trend: DTrend,
- (Intermediate-Term) 2. HiLo Trend: DTrend,
- 3. Pvt. Evolve: Pvt low 750.36,
- 4. Pvt. Next: Pvt high 763.54,
- 5. Levels R: 781.62, 774.44, 773.36,
- 6. Levels S: 750.36, 749.10, 729.10, 716.58.
Daily Benchmarks
- (Short-Term) 5 Day: 767.33 Up Trend,
- (Short-Term) 10 Day: 767.25 Up Trend,
- (Intermediate-Term) 20 Day: 771.48 Down Trend,
- (Intermediate-Term) 55 Day: 765.02 Up Trend,
- (Long-Term) 100 Day: 759.91 Up Trend,
- (Long-Term) 200 Day: 728.53 Up Trend.
Additional Metrics
- ATR: 24.14,
- VOLMA: 47470907.
Overall Rating
- Short-Term: Bearish,
- Intermediate-Term: Bearish,
- Long-Term: Bullish.
Key Insights Summary
SPY futures-equivalent price action finished with a large downside expansion bar into the 750.36 pivot-low area, shifting the short-term structure to a DTrend and placing price beneath the 5, 10, 20, 55, and 100-day benchmarks. The October monthly grid is being traded below its F0%/NTZ region, confirming an intermediate-term countertrend selloff. The 750.36 and 749.10 support cluster is the immediate downside reference, while 763.54 is the pivot-reversal threshold; above it, 773.36 through 774.44 forms the next resistance band. Despite the sharp October retracement, the rising 100-day and 200-day averages retain a constructive longer-cycle backdrop, with 728.53 and 729.10 representing the larger support confluence.
Chart Analysis ATS AI Generated: 2026-10-31 07:08 for Informational use only, not trading advice. Terms and Risk Disclosure Copyright © 2026. Algo Trading Systems LLC.