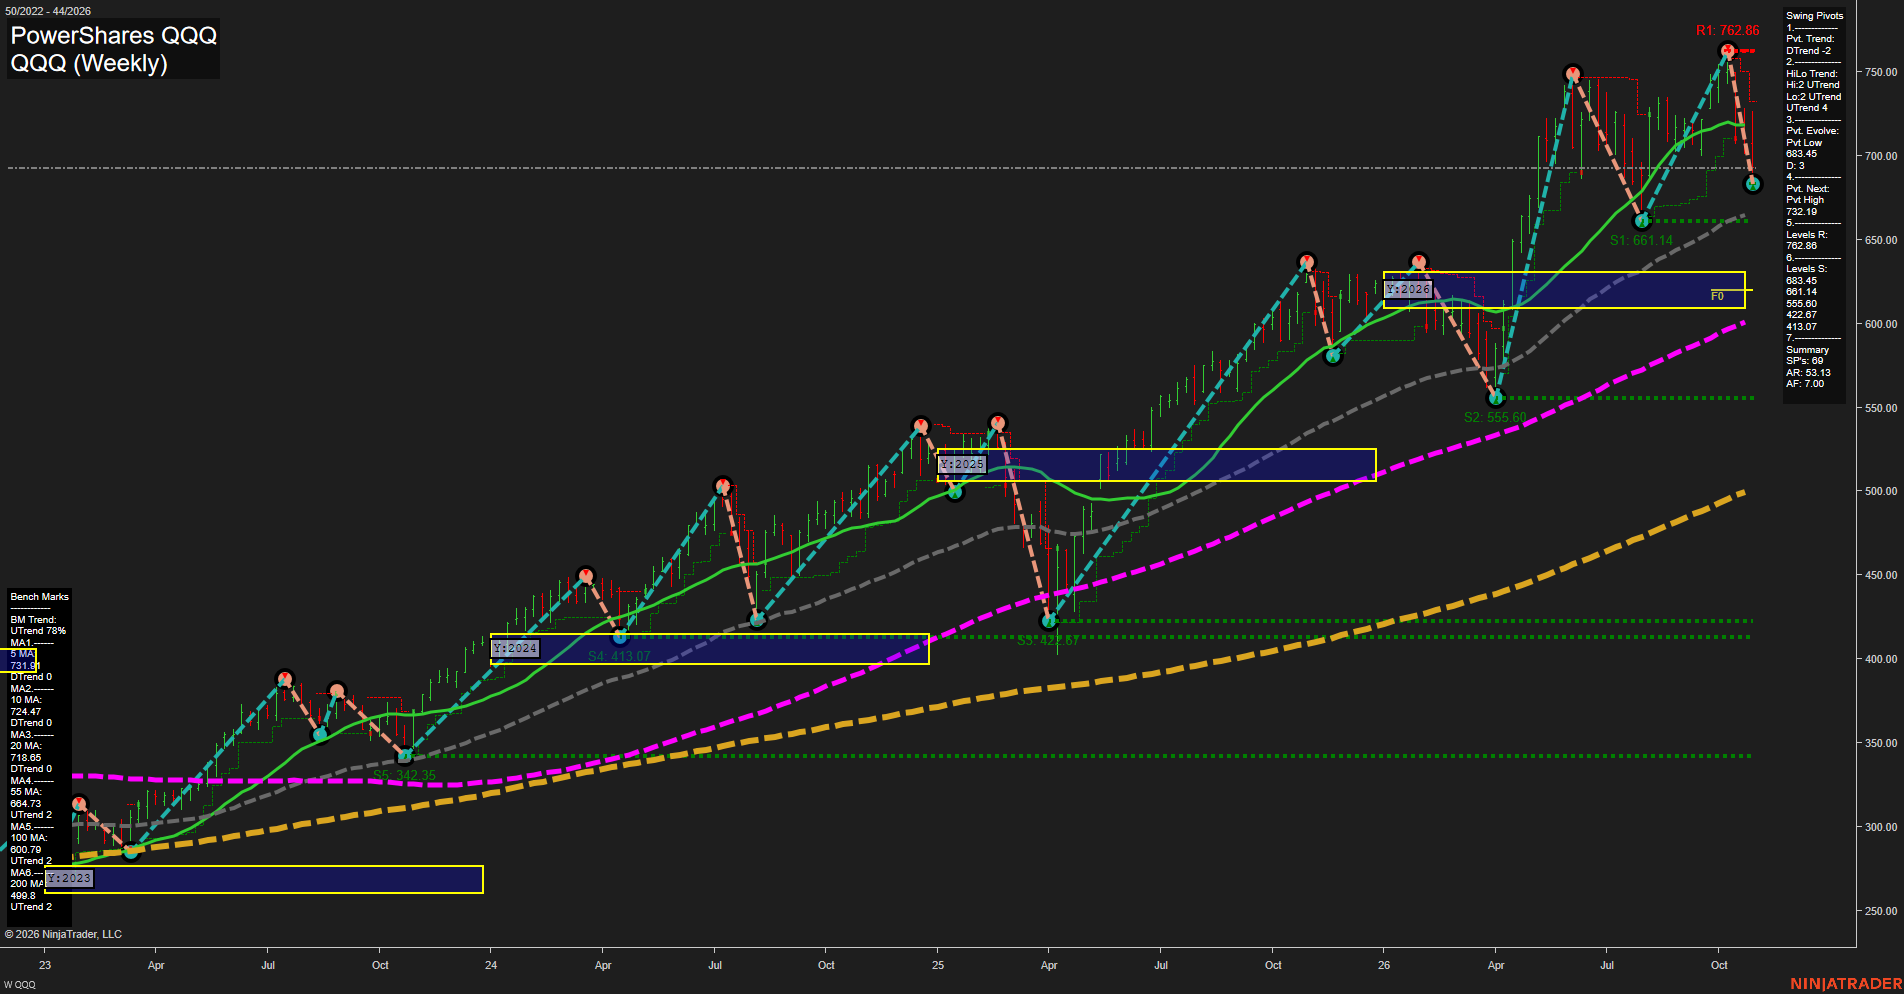
QQQ PowerShares QQQ Weekly Chart Analysis: 2026-Oct-31 07:06 CT
Price Action
- Last: 683.45,
- Bars: Large,
- Mom: fast.
WSFG Weekly
- Short-Term
- WSFG Current: NA%
- F0%/NTZ' Bias: Price Neutral,
- WSFG Trend: Neutral.
MSFG Month Oct
- Intermediate-Term
- MSFG Current: NA%
- F0%/NTZ' Bias: Price Neutral,
- MSFG Trend: Neutral.
YSFG Year 2026
- Long-Term
- YSFG Current: NA%
- F0%/NTZ' Bias: Price Above NTZ,
- YSFG Trend: Bullish.
Swing Pivots
- (Short-Term) 1. Pvt. Trend: DTrend,
- (Intermediate-Term) 2. HiLo Trend: UTrend,
- 3. Pvt. Evolve: Pvt low 683.45,
- 4. Pvt. Next: Pvt high 732.19,
- 5. Levels R: 762.86,
- 6. Levels S: 681.14, 555.60, 422.67, 413.07, 342.35.
Weekly Benchmarks
- (Short-Term) 5 Day: 731.91 Down Trend,
- (Short-Term) 10 Day: 724.47 Down Trend,
- (Intermediate-Term) 20 Day: 718.65 Down Trend,
- (Intermediate-Term) 55 Day: 664.73 Up Trend,
- (Long-Term) 100 Day: 600.79 Up Trend,
- (Long-Term) 200 Day: 498.91 Up Trend.
Overall Rating
- Short-Term: Bearish,
- Intermediate-Term: Bullish,
- Long-Term: Bullish.
Key Insights Summary
QQQ is undergoing a fast short-term corrective swing after rejection from the 762.86 pivot high. Price is below the declining 5, 10, and 20-week benchmarks, confirming downside short-term momentum, while 681.14 is the immediate structural pivot-low support. The intermediate and long-term structure remains constructive: the HiLo trend is still upward, price remains above the rising 55, 100, and 200-week benchmarks, and it is holding above the 2026 yearly NTZ/F0% area. From a futures swing-trader perspective, this is a countertrend liquidation phase inside a broader higher-high and higher-low advance; the 732.19 pivot threshold defines the near-term recovery structure, while sustained trade below 681.14 would emphasize a deeper retracement toward the rising 55-week benchmark near 664.73.
Chart Analysis ATS AI Generated: 2026-10-31 07:06 for Informational use only, not trading advice. Terms and Risk Disclosure Copyright © 2026. Algo Trading Systems LLC.