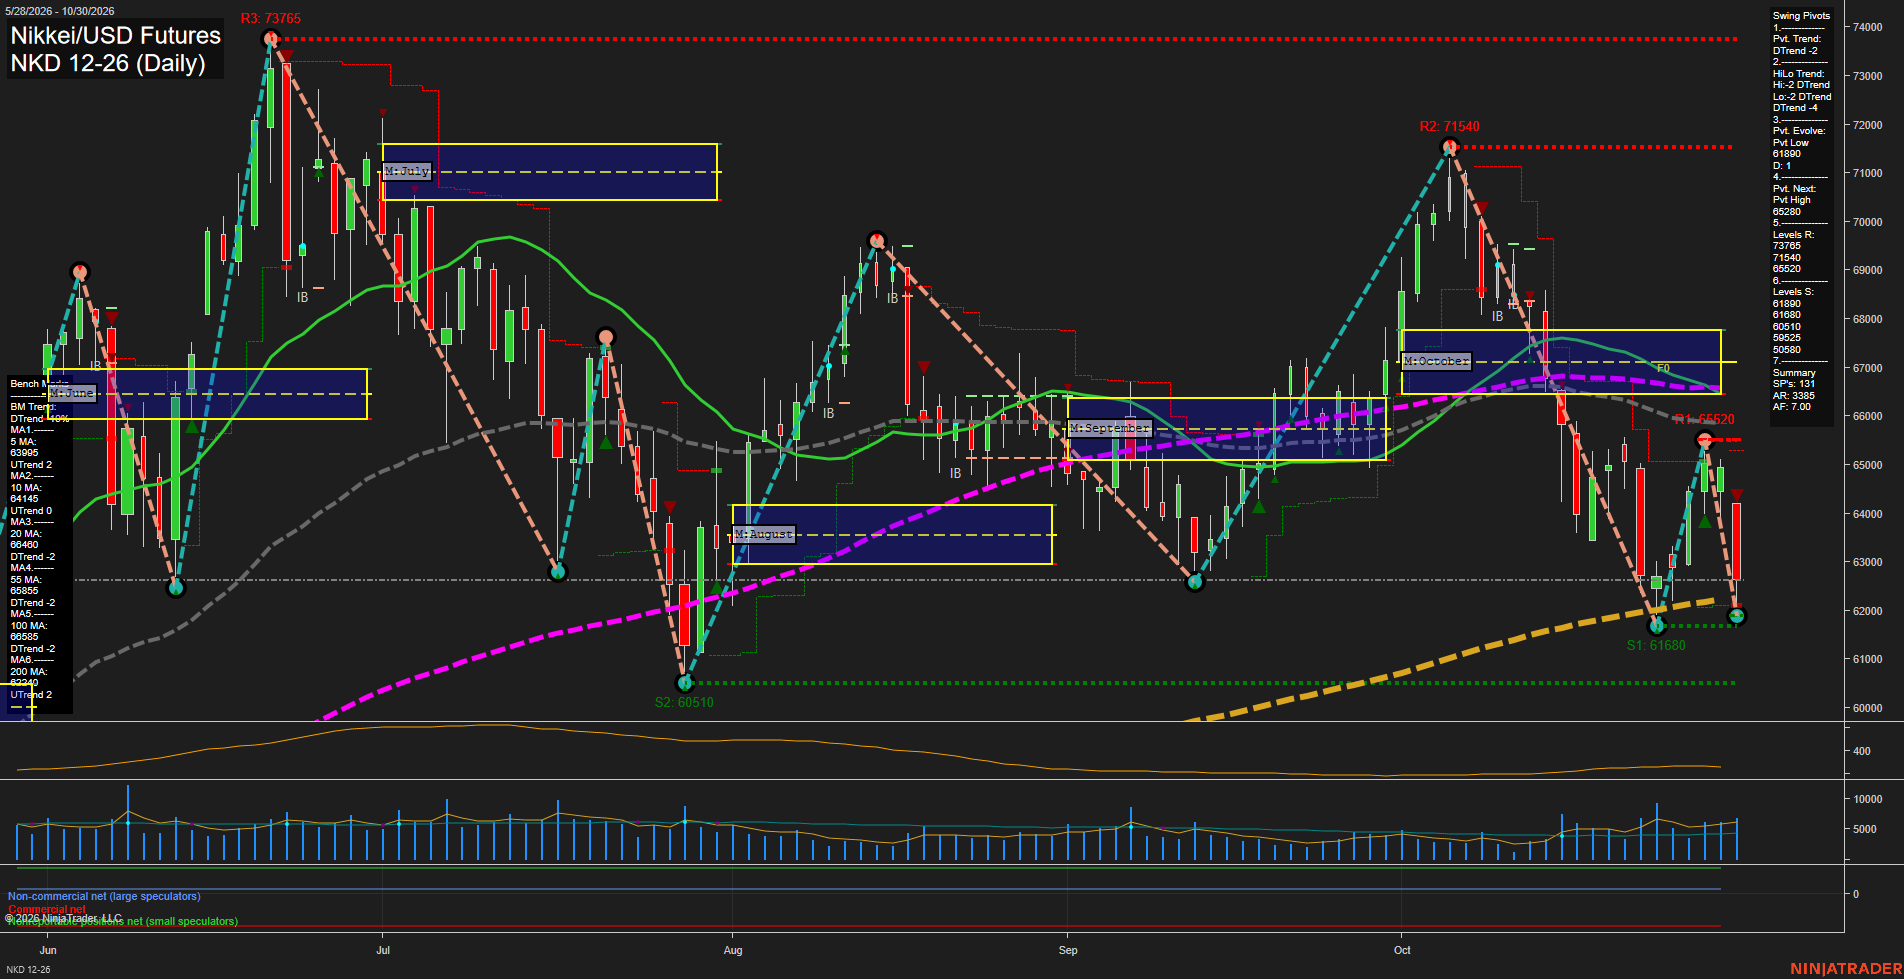
NKD Nikkei/USD Futures Daily Chart Analysis: 2026-Oct-31 07:05 CT
Price Action
- Last: 61890,
- Bars: Large,
- Mom: fast.
WSFG Weekly
- Short-Term
- WSFG Current: -7%
- F0%/NTZ' Bias: Price Below,
- WSFG Trend: Down.
MSFG Month Oct
- Intermediate-Term
- MSFG Current: -80%
- F0%/NTZ' Bias: Price Below,
- MSFG Trend: Down.
YSFG Year 2026
- Long-Term
- YSFG Current: 141%
- F0%/NTZ' Bias: Price Above,
- YSFG Trend: Up.
Swing Pivots
- (Short-Term) 1. Pvt. Trend: DTrend,
- (Intermediate-Term) 2. HiLo Trend: DTrend,
- 3. Pvt. Evolve: Pvt low 61890,
- 4. Pvt. Next: Pvt high 65280,
- 5. Levels R: 73765, 71540, 65520,
- 6. Levels S: 61890, 60510, 59525.
Daily Benchmarks
- (Short-Term) 5 Day: 63995 Up Trend,
- (Short-Term) 10 Day: 64145 Up Trend,
- (Intermediate-Term) 20 Day: 65440 Down Trend,
- (Intermediate-Term) 55 Day: 65855 Down Trend,
- (Long-Term) 100 Day: 65890 Down Trend,
- (Long-Term) 200 Day: 62240 Up Trend.
Additional Metrics
Recent Trade Signals
- 30 Oct 2026: Short NKD 12-26 @ 62160 Signals.USAR-WSFG
- 27 Oct 2026: Long NKD 12-26 @ 63820 Signals.USAR.TR120
Overall Rating
- Short-Term: Bearish,
- Intermediate-Term: Bearish,
- Long-Term: Neutral.
Key Insights Summary
NKD completed a sharp October reversal from the 71540 swing high and has returned to the 61890 pivot-low area on expanding downside momentum. Price is below the weekly and monthly F0%/NTZ structures and below the 5, 10, 20, 55, and 100-day benchmarks, maintaining a short-term and intermediate-term lower-high/lower-low sequence. The 200-day average remains below price and rising, preserving a constructive longer-term structural backdrop, but the current decline is testing that broader support zone. The 65280 pivot-high reversal level and 65520 resistance are the nearest overhead technical references, while 60510 is the next major lower swing support beneath the current 61890 pivot.
Chart Analysis ATS AI Generated: 2026-10-31 07:06 for Informational use only, not trading advice. Terms and Risk Disclosure Copyright © 2026. Algo Trading Systems LLC.