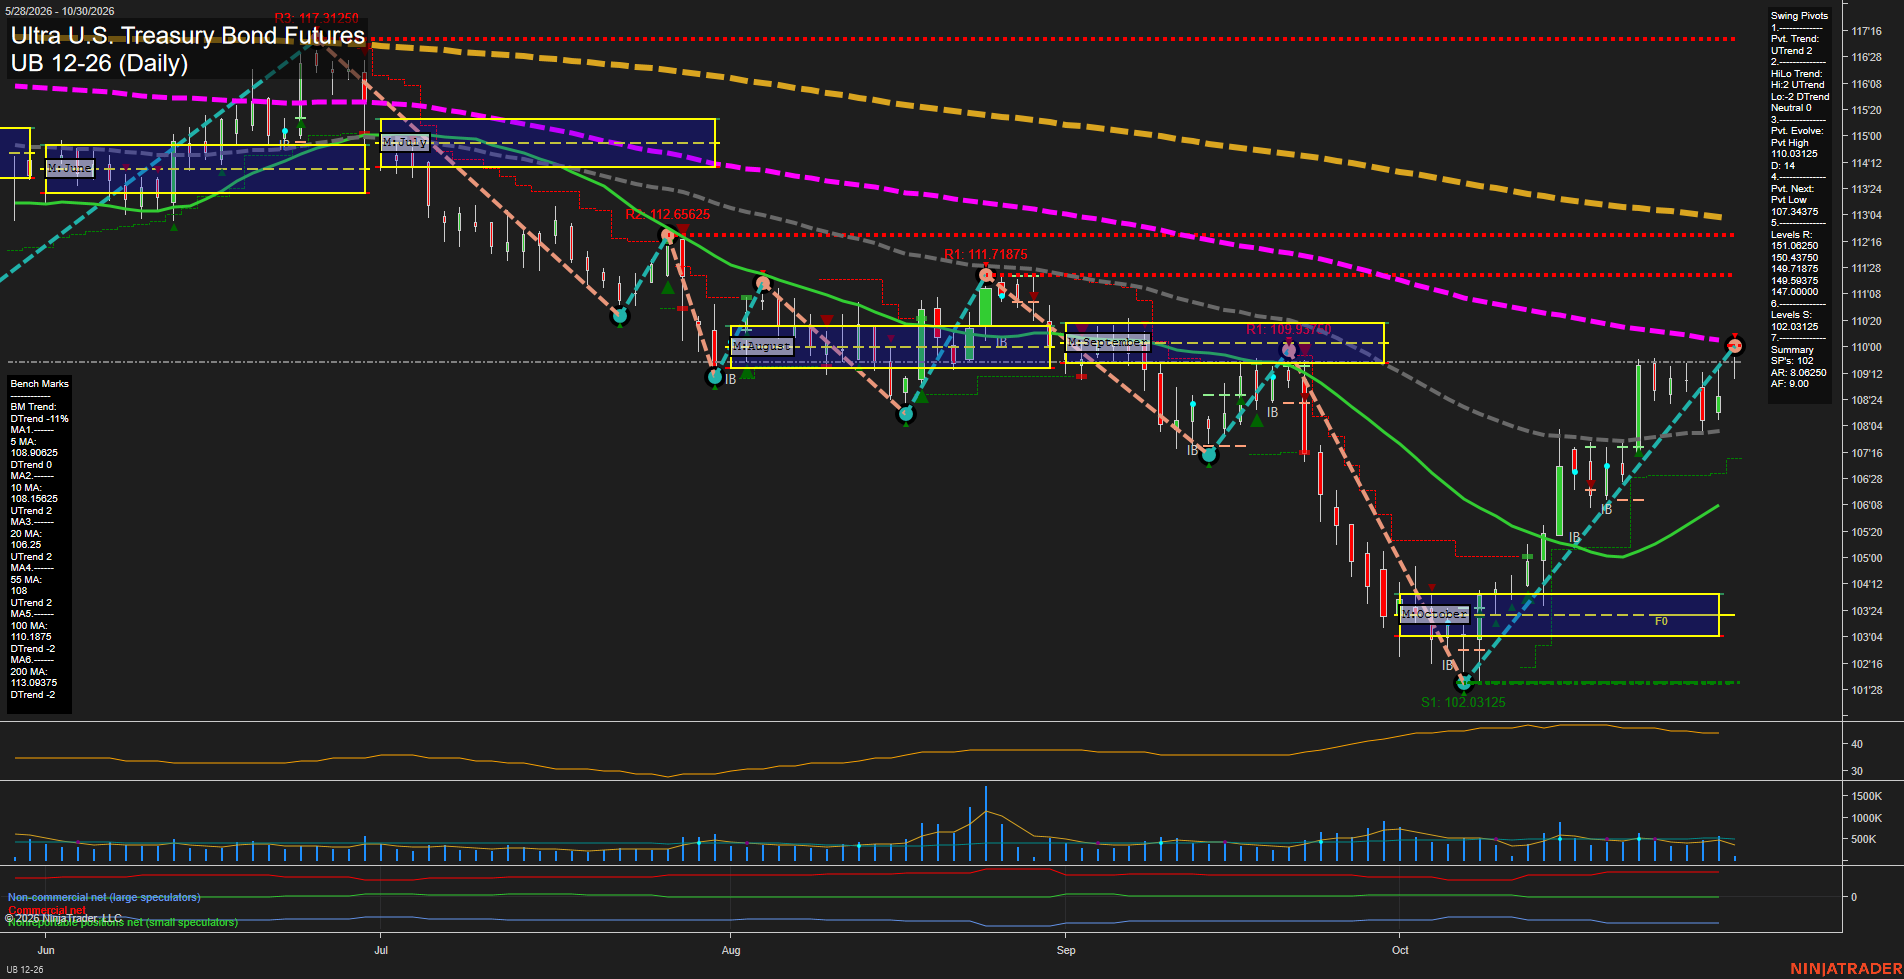
UB Ultra U.S. Treasury Bond Futures Daily Chart Analysis: 2026-Oct-30 07:10 CT
Price Action
- Last: 109.6875,
- Bars: Medium,
- Mom: fast.
WSFG Weekly
- Short-Term
- WSFG Current: 14%
- F0%/NTZ' Bias: Price Above,
- WSFG Trend: Up.
MSFG Month Oct
- Intermediate-Term
- MSFG Current: 110%
- F0%/NTZ' Bias: Price Above,
- MSFG Trend: Up.
YSFG Year 2026
- Long-Term
- YSFG Current: -22%
- F0%/NTZ' Bias: Price Below,
- YSFG Trend: Down.
Swing Pivots
- (Short-Term) 1. Pvt. Trend: UTrend,
- (Intermediate-Term) 2. HiLo Trend: UTrend,
- 3. Pvt. Evolve: Pvt high 109.9375,
- 4. Pvt. Next: Pvt low 107.34375,
- 5. Levels R: 151.06250, 150.43750, 149.71875, 149.59375, 147.00000,
- 6. Levels S: 102.03125.
Daily Benchmarks
- (Short-Term) 5 Day: 108.90625 Down Trend,
- (Short-Term) 10 Day: 108.15625 Up Trend,
- (Intermediate-Term) 20 Day: 106.0625 Up Trend,
- (Intermediate-Term) 55 Day: 108.4375 Up Trend,
- (Long-Term) 100 Day: 110.1875 Down Trend,
- (Long-Term) 200 Day: 113.09375 Down Trend.
Additional Metrics
Recent Trade Signals
- 30 Oct 2026: Long UB 12-26 @ 109.6875 Signals.USAR-WSFG
Overall Rating
- Short-Term: Bullish,
- Intermediate-Term: Bullish,
- Long-Term: Bearish.
Key Insights Summary
UB has staged a fast V-shaped recovery from the October 102.03125 pivot low, with price reclaiming the weekly and monthly F0%/NTZ structures and closing above the 5-, 10-, 20-, and 55-day benchmarks. The active pivot structure is UTrend/UTrend, although the current rally is pressing into the 109.9375 pivot-high area beneath the declining 100-day average at 110.1875. This creates a short-term recovery phase within a still-weaker long-term structure, as the 100-day and 200-day benchmarks remain in downtrends and price remains below the yearly grid. Momentum is fast, ATR is elevated at 46, and the recent advance reflects expanding swing range following the October washout rather than a low-volatility consolidation.
Chart Analysis ATS AI Generated: 2026-10-30 07:10 for Informational use only, not trading advice. Terms and Risk Disclosure Copyright © 2026. Algo Trading Systems LLC.