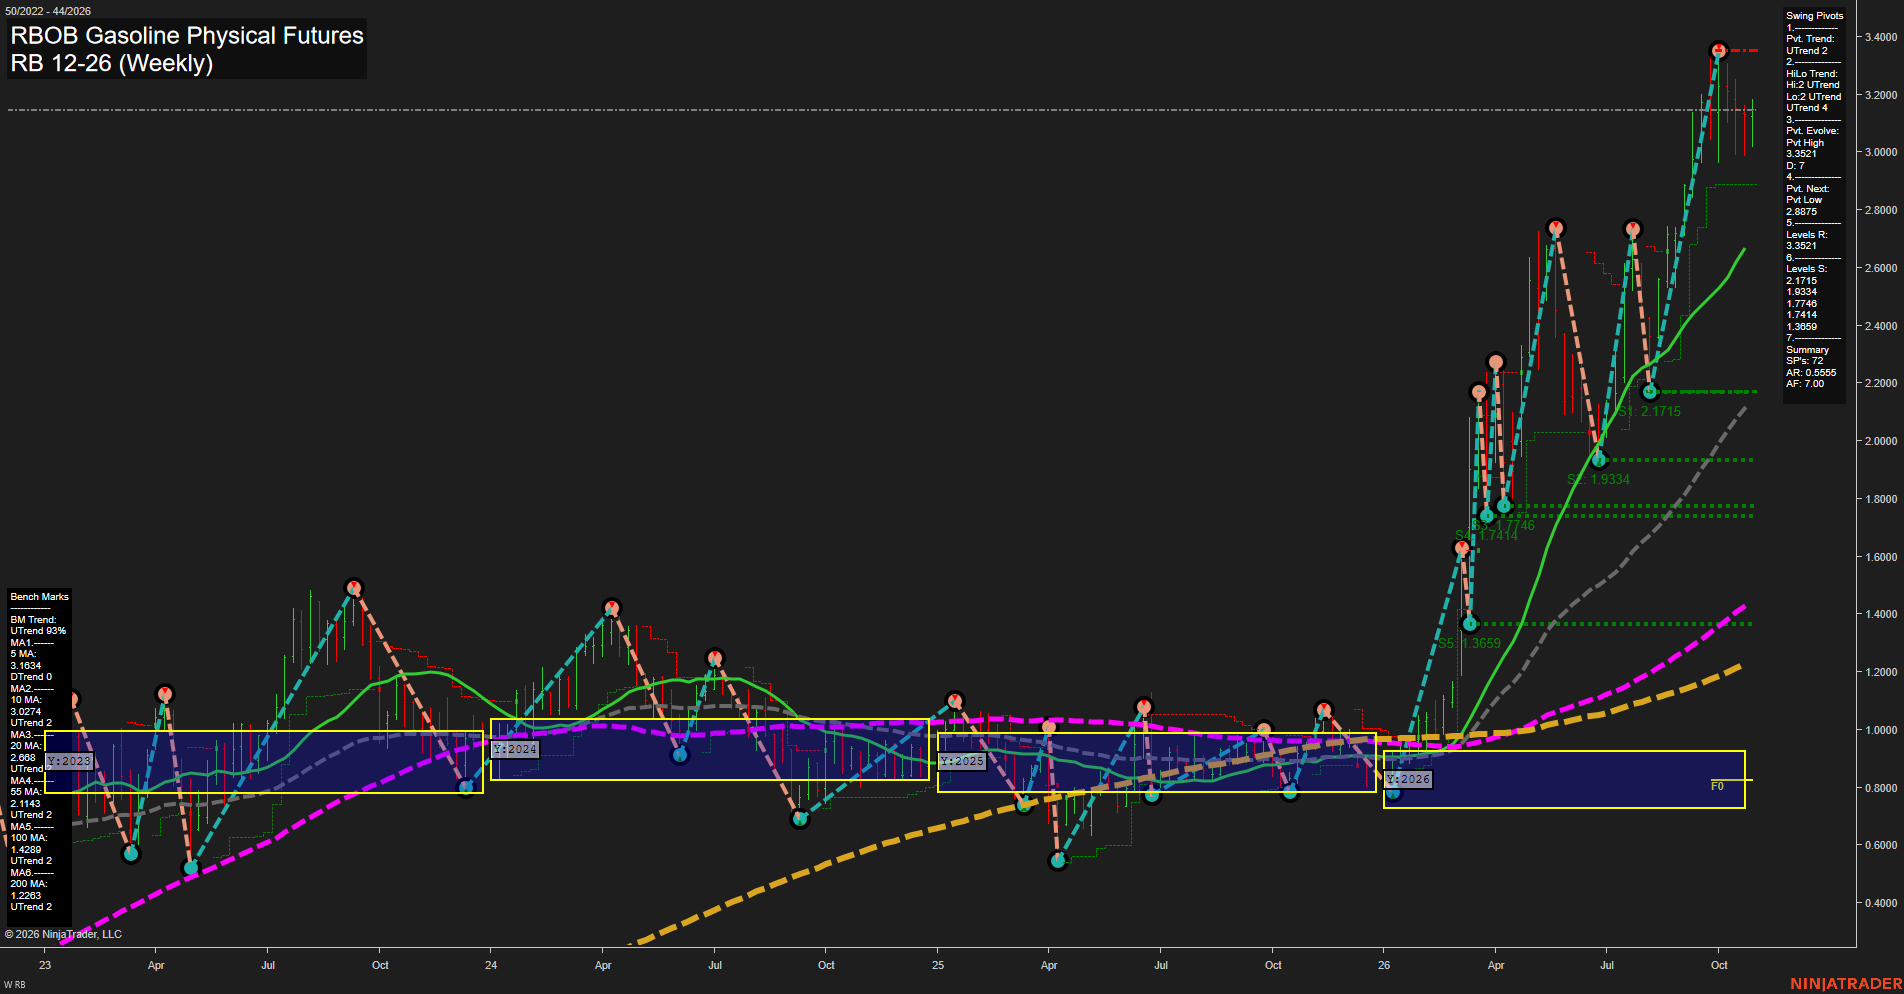
RB RBOB Gasoline Physical Futures Weekly Chart Analysis: 2026-Oct-30 07:08 CT
Price Action
- Last: 3.1521,
- Bars: Large,
- Mom: fast.
WSFG Weekly
- Short-Term
- WSFG Current: 22%
- F0%/NTZ' Bias: Price Above,
- WSFG Trend: Up.
MSFG Month Oct
- Intermediate-Term
- MSFG Current: -3%
- F0%/NTZ' Bias: Price Below,
- MSFG Trend: Down.
YSFG Year 2026
- Long-Term
- YSFG Current: 235%
- F0%/NTZ' Bias: Price Above,
- YSFG Trend: Up.
Swing Pivots
- (Short-Term) 1. Pvt. Trend: UTrend,
- (Intermediate-Term) 2. HiLo Trend: UTrend,
- 3. Pvt. Evolve: Pvt high 3.3521,
- 4. Pvt. Next: Pvt low 2.8875,
- 5. Levels R: 3.3521,
- 6. Levels S: 2.1715, 1.9334, 1.7746, 1.7414, 1.3659.
Weekly Benchmarks
- (Short-Term) 5 Day: 3.1635 Down Trend,
- (Short-Term) 10 Day: 3.0274 Up Trend,
- (Intermediate-Term) 20 Day: 2.6863 Up Trend,
- (Intermediate-Term) 55 Day: 2.1143 Up Trend,
- (Long-Term) 100 Day: 1.4289 Up Trend,
- (Long-Term) 200 Day: 1.2283 Up Trend.
Recent Trade Signals
- 30 Oct 2026: Long RB 12-26 @ 3.1133 Signals.USAR-WSFG
- 29 Oct 2026: Short RB 12-26 @ 3.0953 Signals.USAR-MSFG
- 23 Oct 2026: Long RB 12-26 @ 3.1192 Signals.USAR.TR120
Overall Rating
- Short-Term: Bullish,
- Intermediate-Term: Bullish,
- Long-Term: Bullish.
Key Insights Summary
Price is consolidating beneath the 3.3521 pivot-high resistance after a steep, fast-momentum advance. The weekly pivot structure remains constructive with higher lows and an active UTrend, while price holds well above the rising 10, 20, 55, 100, and 200 period benchmarks. The declining 5 period average and the monthly grid position below F0% describe a near-term countertrend pause within the broader bullish recovery. A sustained move through 3.3521 would extend the breakout structure, while 2.8875 defines the next pivot-reversal threshold and the first meaningful retracement reference.
Chart Analysis ATS AI Generated: 2026-10-30 07:08 for Informational use only, not trading advice. Terms and Risk Disclosure Copyright © 2026. Algo Trading Systems LLC.