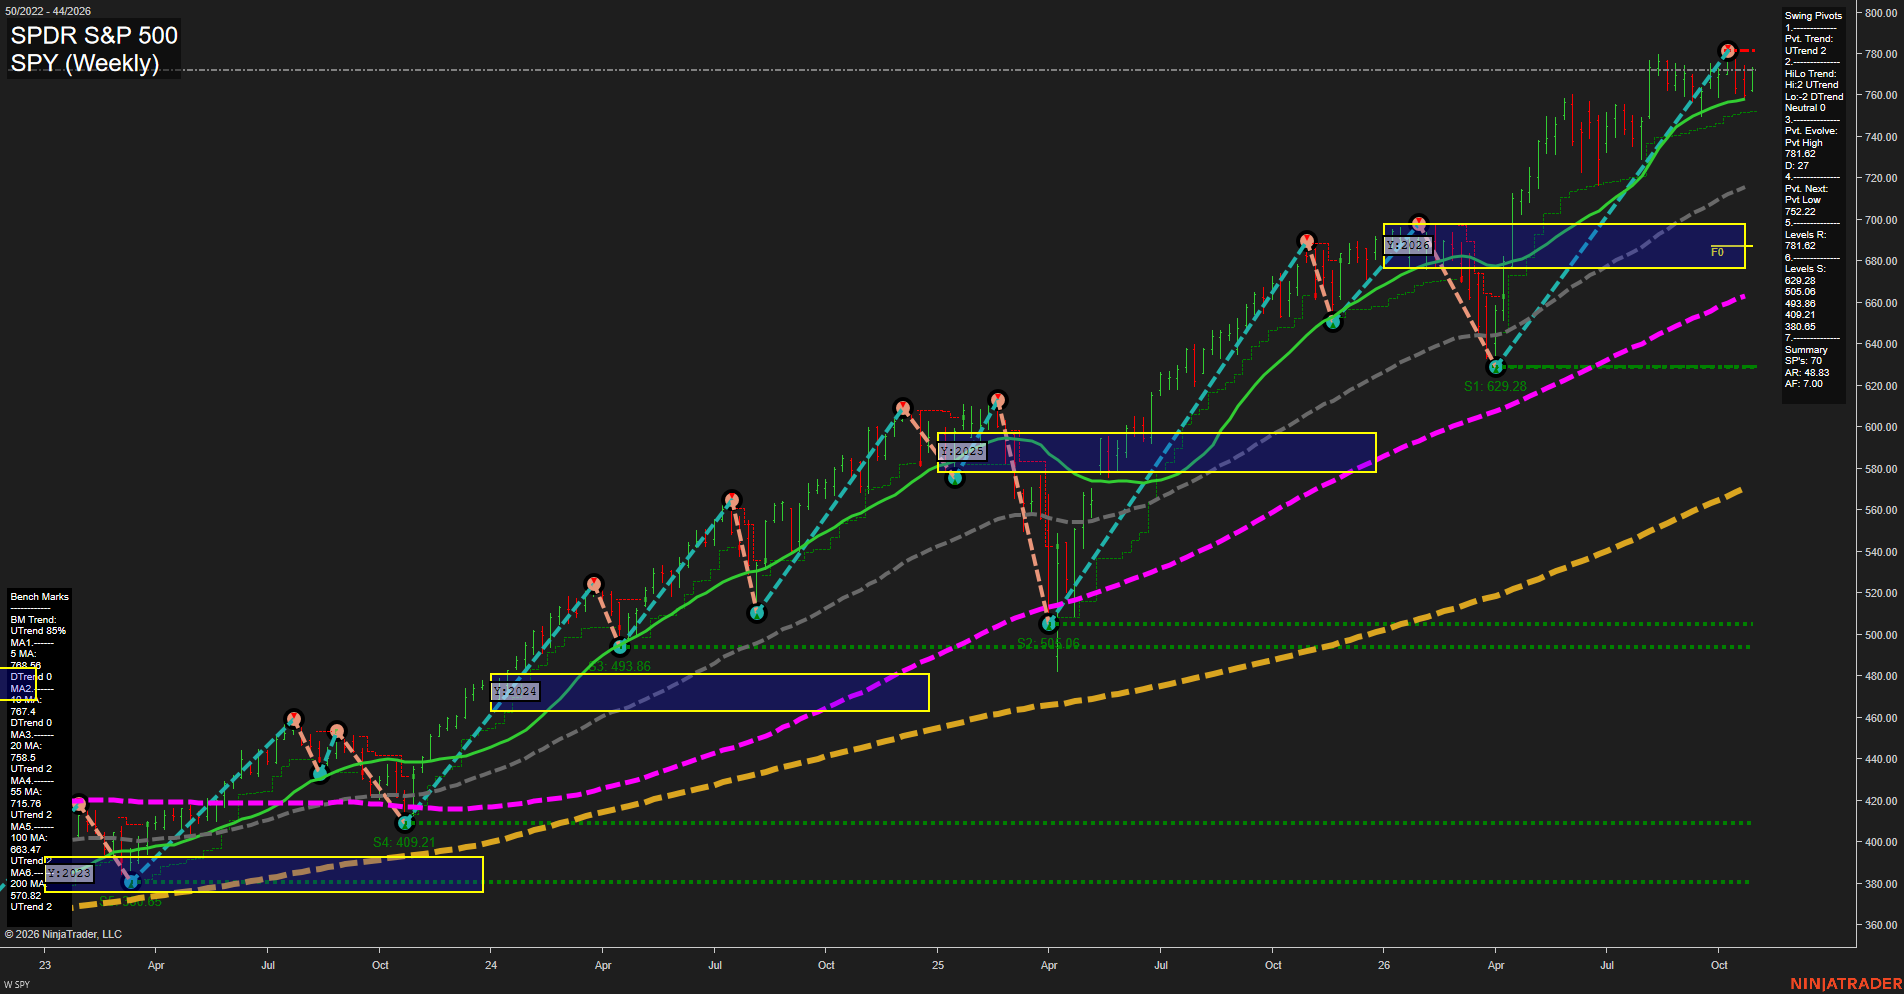
SPY SPDR S&P 500 Weekly Chart Analysis: 2026-Oct-29 07:10 CT
Price Action
- Last: 771.44,
- Bars: Medium,
- Mom: Momentum average.
WSFG Weekly
- Short-Term
- WSFG Current: NA%
- F0%/NTZ' Bias: Price Neutral,
- WSFG Trend: Neutral.
MSFG Month Oct
- Intermediate-Term
- MSFG Current: NA%
- F0%/NTZ' Bias: Price Neutral,
- MSFG Trend: Neutral.
YSFG Year 2026
- Long-Term
- YSFG Current: Above F0%,
- F0%/NTZ' Bias: Price Bullish,
- YSFG Trend: Bullish.
Swing Pivots
- (Short-Term) 1. Pvt. Trend: DTrend,
- (Intermediate-Term) 2. HiLo Trend: UTrend,
- 3. Pvt. Evolve: Pvt high 781.62,
- 4. Pvt. Next: Pvt low 752.22,
- 5. Levels R: 781.62,
- 6. Levels S: 692.28, 505.06, 493.86, 409.21, 380.65.
Weekly Benchmarks
- (Short-Term) 5 Day: 788.68 Down Trend,
- (Short-Term) 10 Day: 767.40 Down Trend,
- (Intermediate-Term) 20 Day: 758.50 Up Trend,
- (Intermediate-Term) 55 Day: 715.76 Up Trend,
- (Long-Term) 100 Day: 663.47 Up Trend,
- (Long-Term) 200 Day: 570.82 Up Trend.
Overall Rating
- Short-Term: Bearish,
- Intermediate-Term: Bullish,
- Long-Term: Bullish.
Key Insights Summary
SPY remains in a broad weekly bull structure, with price above the rising 20-, 55-, 100-, and 200-week benchmarks and materially above the 2026 yearly F0% zone. From a futures swing-trader perspective, the immediate structure is a counter-trend pullback/consolidation following the 781.62 pivot high: the short-term pivot trend and 5- and 10-week benchmarks have turned down, while the intermediate higher-high/higher-low sequence remains intact. The 752.22 pivot-next level and rising 20-week benchmark near 758.50 define the nearby structural area beneath current trade, while 781.62 remains the overhead pivot reference. The recent weekly candles reflect reduced upside momentum after an extended advance, but the longer-term trend alignment remains positive.
Chart Analysis ATS AI Generated: 2026-10-29 07:10 for Informational use only, not trading advice. Terms and Risk Disclosure Copyright © 2026. Algo Trading Systems LLC.