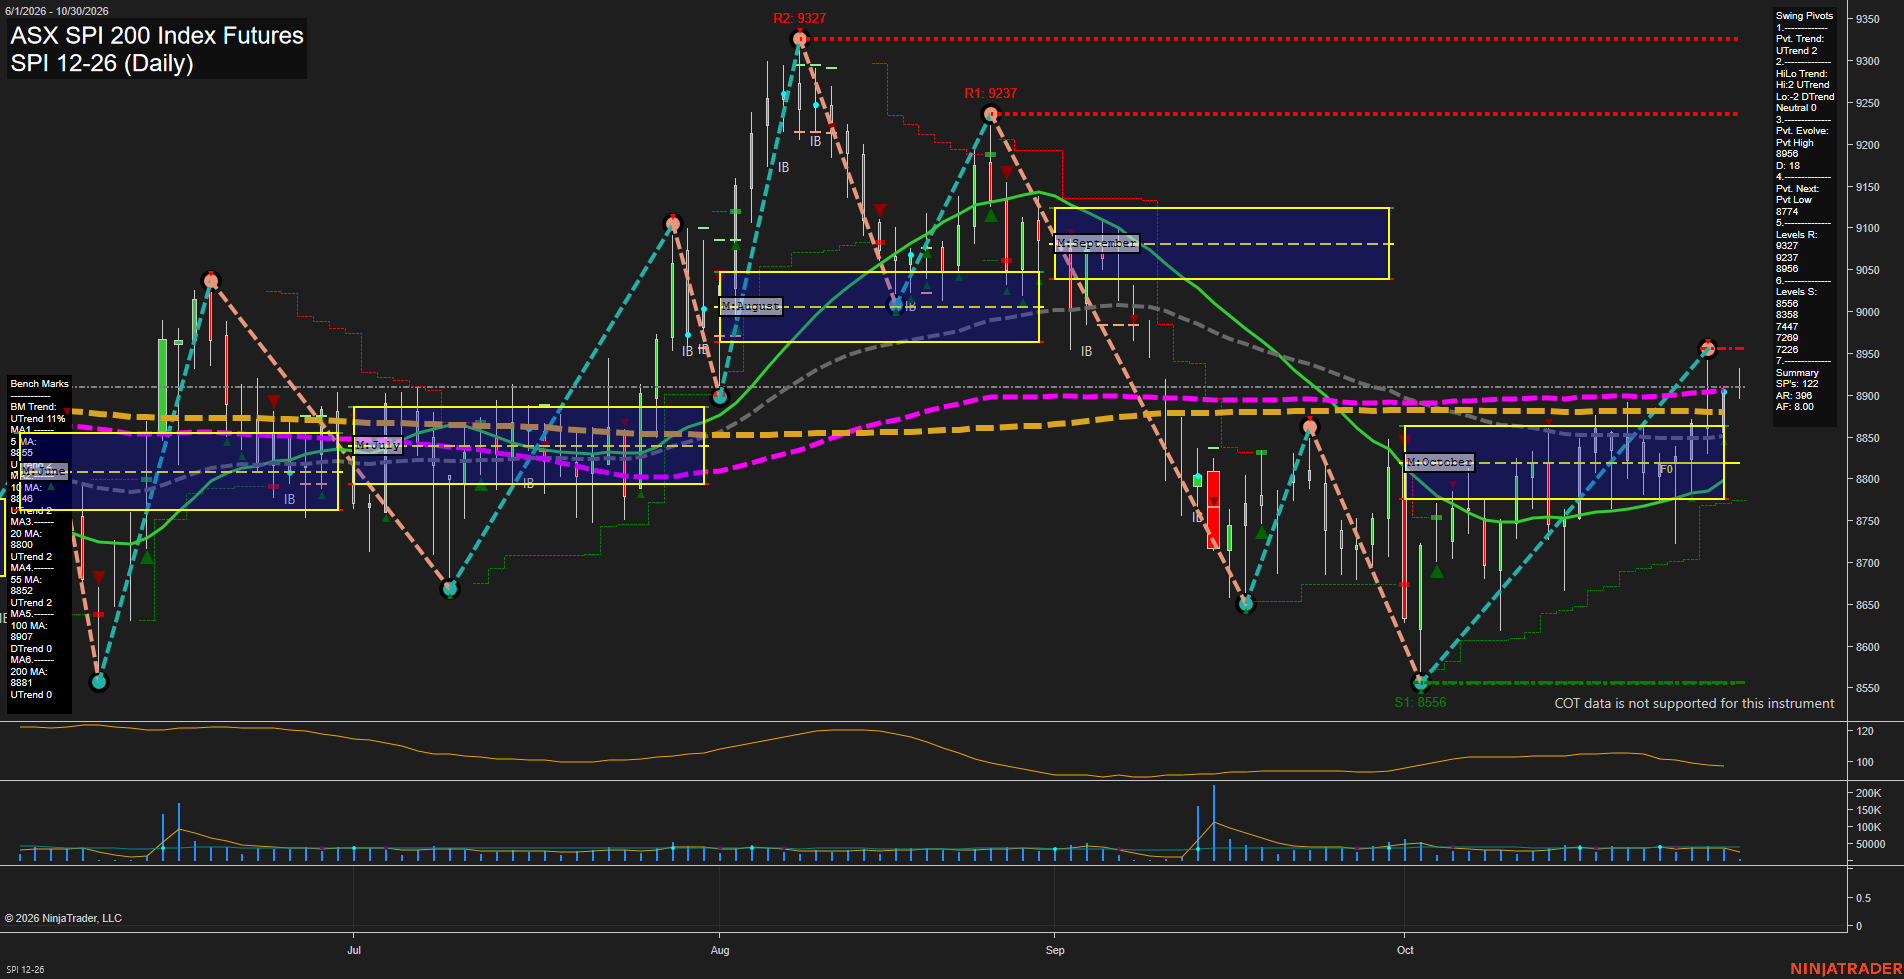
SPI ASX SPI 200 Index Futures Daily Chart Analysis: 2026-Oct-29 07:09 CT
Price Action
- Last: 8922,
- Bars: Small,
- Mom: average.
WSFG Weekly
- Short-Term
- WSFG Current: NA%
- F0%/NTZ' Bias: Price Neutral,
- WSFG Trend: Neutral.
MSFG Month Oct
- Intermediate-Term
- MSFG Current: NA%
- F0%/NTZ' Bias: Price Above NTZ,
- MSFG Trend: Bullish.
YSFG Year 2026
- Long-Term
- YSFG Current: NA%
- F0%/NTZ' Bias: Price Neutral,
- YSFG Trend: Neutral.
Swing Pivots
- (Short-Term) 1. Pvt. Trend: UTrend,
- (Intermediate-Term) 2. HiLo Trend: UTrend,
- 3. Pvt. Evolve: Pvt high 8956,
- 4. Pvt. Next: Pvt low 8774,
- 5. Levels R: 9327, 9237, 8956,
- 6. Levels S: 8556, 8357, 7447, 7269.
Daily Benchmarks
- (Short-Term) 5 Day: 8845 Up Trend,
- (Short-Term) 10 Day: 8846 Up Trend,
- (Intermediate-Term) 20 Day: 8800 Up Trend,
- (Intermediate-Term) 55 Day: 8852 Up Trend,
- (Long-Term) 100 Day: 8907 Down Trend,
- (Long-Term) 200 Day: 8818 Up Trend.
Additional Metrics
Overall Rating
- Short-Term: Bullish,
- Intermediate-Term: Bullish,
- Long-Term: Neutral.
Key Insights Summary
SPI futures have produced a sharp V-style recovery from the 8556 swing low and are consolidating just beneath the active 8956 pivot-high resistance. Price is above the rising 5, 10, 20, and 55-day benchmarks, while the intermediate pivot structure remains in an UTrend. The October monthly grid has been reclaimed above its upper NTZ area, supporting the recovery phase, although the declining 100-day average near 8907 remains a longer-cycle transition marker. Recent small bars and moderating volume indicate compression below 8956 after the fast rebound, with 9237 and 9327 the higher pivot-resistance references and 8774 the next pivot-reversal level.
Chart Analysis ATS AI Generated: 2026-10-29 07:09 for Informational use only, not trading advice. Terms and Risk Disclosure Copyright © 2026. Algo Trading Systems LLC.