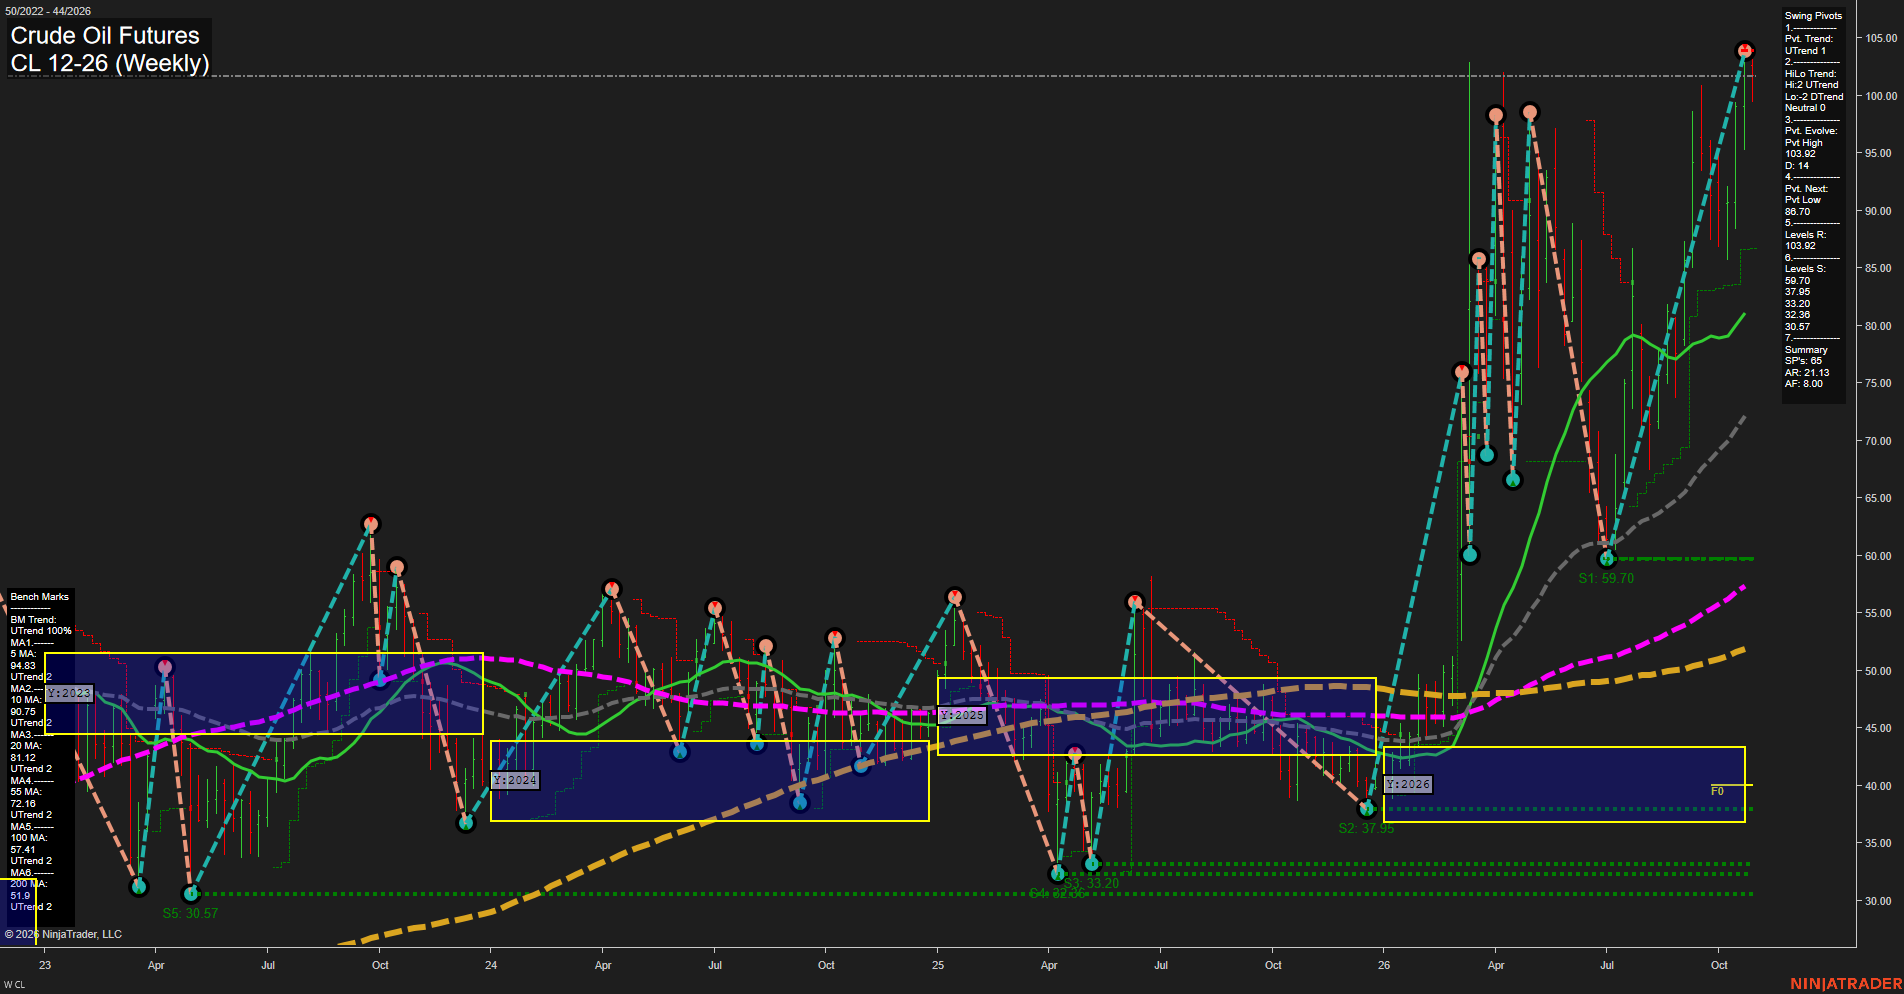
CL Crude Oil Futures Weekly Chart Analysis: 2026-Oct-29 07:02 CT
Price Action
- Last: 101.70,
- Bars: Large,
- Mom: fast.
WSFG Weekly
- Short-Term
- WSFG Current: 14%
- F0%/NTZ' Bias: Price Above,
- WSFG Trend: Up.
MSFG Month Oct
- Intermediate-Term
- MSFG Current: 68%
- F0%/NTZ' Bias: Price Above,
- MSFG Trend: Up.
YSFG Year 2026
- Long-Term
- YSFG Current: 191%
- F0%/NTZ' Bias: Price Above,
- YSFG Trend: Up.
Swing Pivots
- (Short-Term) 1. Pvt. Trend: UTrend,
- (Intermediate-Term) 2. HiLo Trend: UTrend,
- 3. Pvt. Evolve: Pvt high 103.92,
- 4. Pvt. Next: Pvt low 86.70,
- 5. Levels R: 103.92,
- 6. Levels S: 59.70, 37.95, 33.20, 32.36, 30.57.
Weekly Benchmarks
- (Short-Term) 5 Day: 94.89 Up Trend,
- (Short-Term) 10 Day: 90.75 Up Trend,
- (Intermediate-Term) 20 Day: 81.12 Up Trend,
- (Intermediate-Term) 55 Day: 72.16 Up Trend,
- (Long-Term) 100 Day: 57.41 Up Trend,
- (Long-Term) 200 Day: 51.81 Up Trend.
Recent Trade Signals
- 29 Oct 2026: Long CL 12-26 @ 102 Signals.USAR-WSFG
- 27 Oct 2026: Short CL 12-26 @ 99.9 Signals.USAR.TR120
Overall Rating
- Short-Term: Bullish,
- Intermediate-Term: Bullish,
- Long-Term: Bullish.
Key Insights Summary
Price action reflects a high-momentum advance from the July pivot low near 59.70, with higher swing lows and a current challenge of the 103.92 pivot-high resistance. Price remains above every weekly benchmark and above the weekly, monthly, and yearly F0%/NTZ structures, confirming broad multi-timeframe upside alignment. The conflicting late-October short and subsequent long signals reflect volatile two-way trading beneath the prior high, while the pivot structure remains upward unless the evolving swing materially reverses toward the 86.70 pivot threshold.
Chart Analysis ATS AI Generated: 2026-10-29 07:02 for Informational use only, not trading advice. Terms and Risk Disclosure Copyright © 2026. Algo Trading Systems LLC.