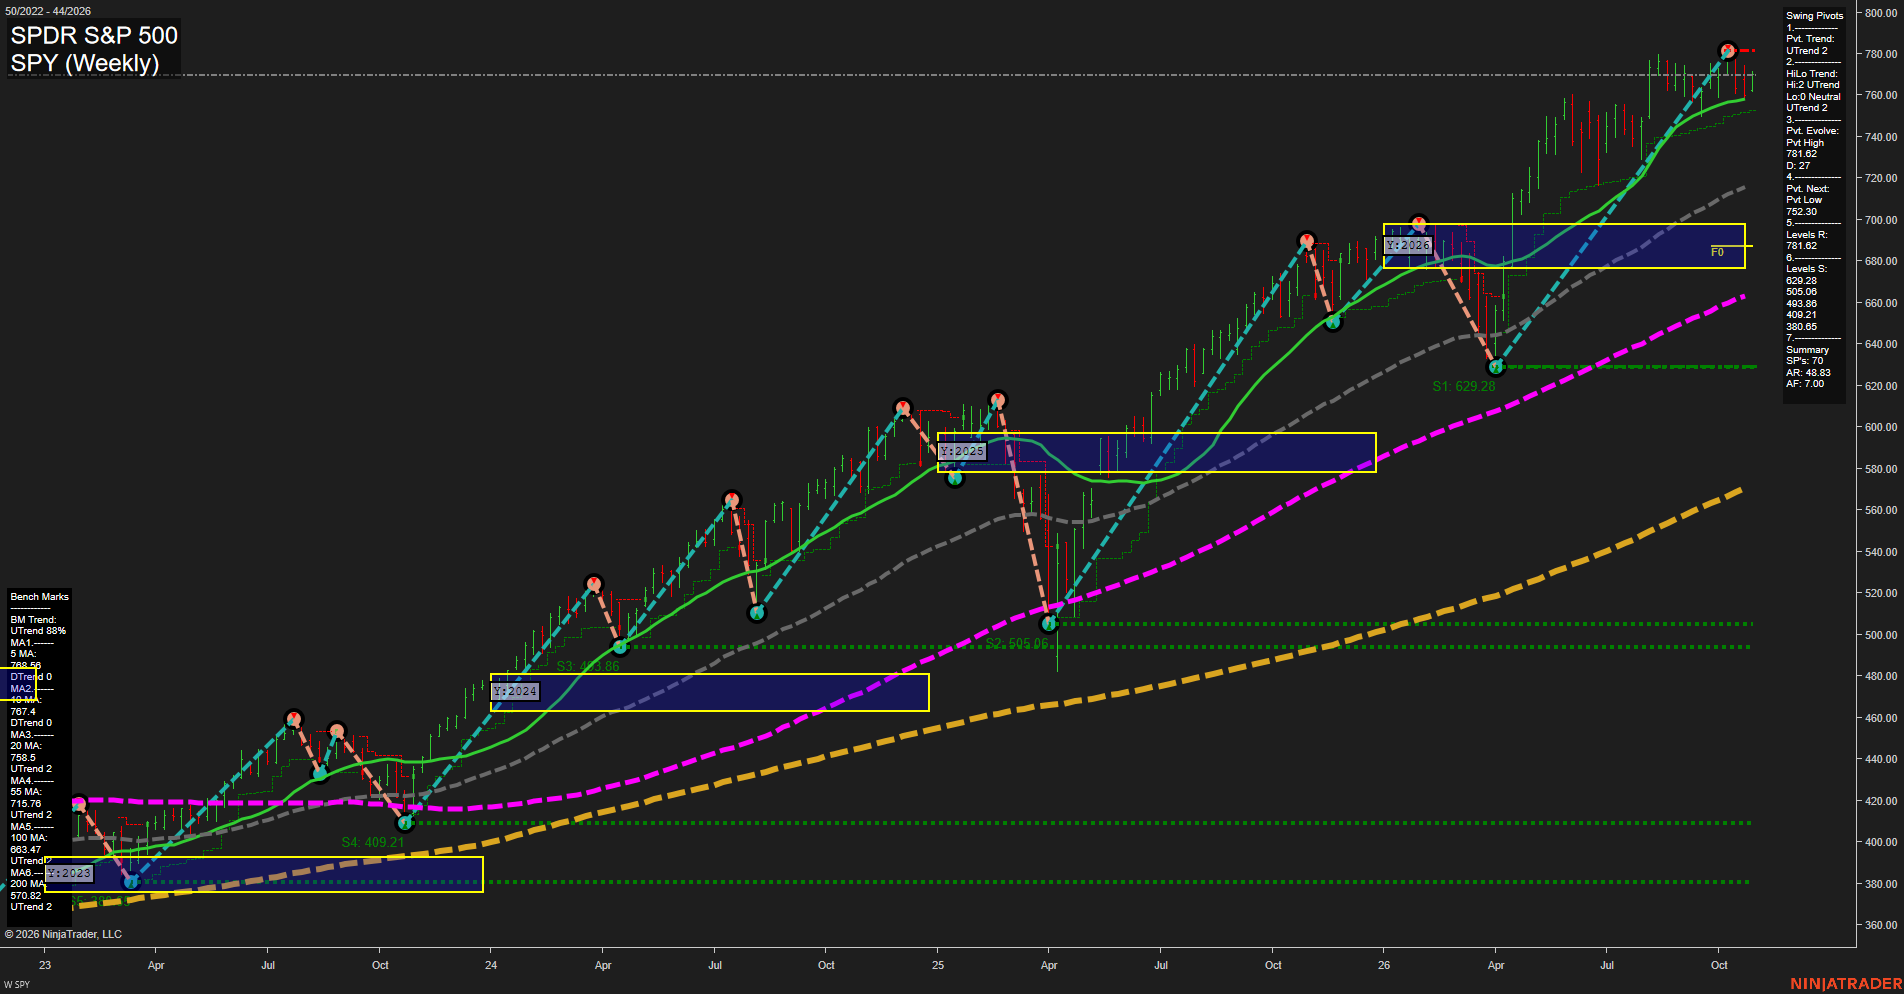
SPY SPDR S&P 500 Weekly Chart Analysis: 2026-Oct-28 07:11 CT
Price Action
- Last: 770.00,
- Bars: Medium,
- Mom: slow.
WSFG Weekly
- Short-Term
- WSFG Current: NA%
- F0%/NTZ' Bias: Price Bullish,
- WSFG Trend: Bullish.
MSFG Month Oct
- Intermediate-Term
- MSFG Current: NA%
- F0%/NTZ' Bias: Price Bullish,
- MSFG Trend: Bullish.
YSFG Year 2026
- Long-Term
- YSFG Current: NA%
- F0%/NTZ' Bias: Price Bullish,
- YSFG Trend: Bullish.
Swing Pivots
- (Short-Term) 1. Pvt. Trend: UTrend,
- (Intermediate-Term) 2. HiLo Trend: UTrend,
- 3. Pvt. Evolve: Pvt high 781.62,
- 4. Pvt. Next: Pvt low 752.30,
- 5. Levels R: 781.62,
- 6. Levels S: 692.28, 650.68, 493.38, 409.21, 380.65.
Weekly Benchmarks
- (Short-Term) 5 Day: 788.98 Up Trend,
- (Short-Term) 10 Day: 767.40 Down Trend,
- (Intermediate-Term) 20 Day: 758.35 Up Trend,
- (Intermediate-Term) 55 Day: 715.76 Up Trend,
- (Long-Term) 100 Day: 663.47 Up Trend,
- (Long-Term) 200 Day: 570.82 Up Trend.
Overall Rating
- Short-Term: Bullish,
- Intermediate-Term: Bullish,
- Long-Term: Bullish.
Key Insights Summary
The futures swing structure remains broadly constructive: price is holding above the rising 20, 55, 100, and 200-week benchmarks while both pivot-trend measures remain in UTrend. The recent 781.62 pivot high defines the near-term upside reference, while 752.30 is the pivot-reversal threshold and aligns closely with the rising 20-week benchmark. The latest weekly bars show consolidation beneath the recent high rather than a confirmed trend reversal; short-term momentum has slowed as the 5-week average turns above price while the 10-week measure is marginally declining. The yearly grid is decisively below current price, reinforcing the long-term expansion phase, with 715.76, 692.28, and 650.68 representing progressively deeper structural support references for index futures swing context.
Chart Analysis ATS AI Generated: 2026-10-28 07:11 for Informational use only, not trading advice. Terms and Risk Disclosure Copyright © 2026. Algo Trading Systems LLC.