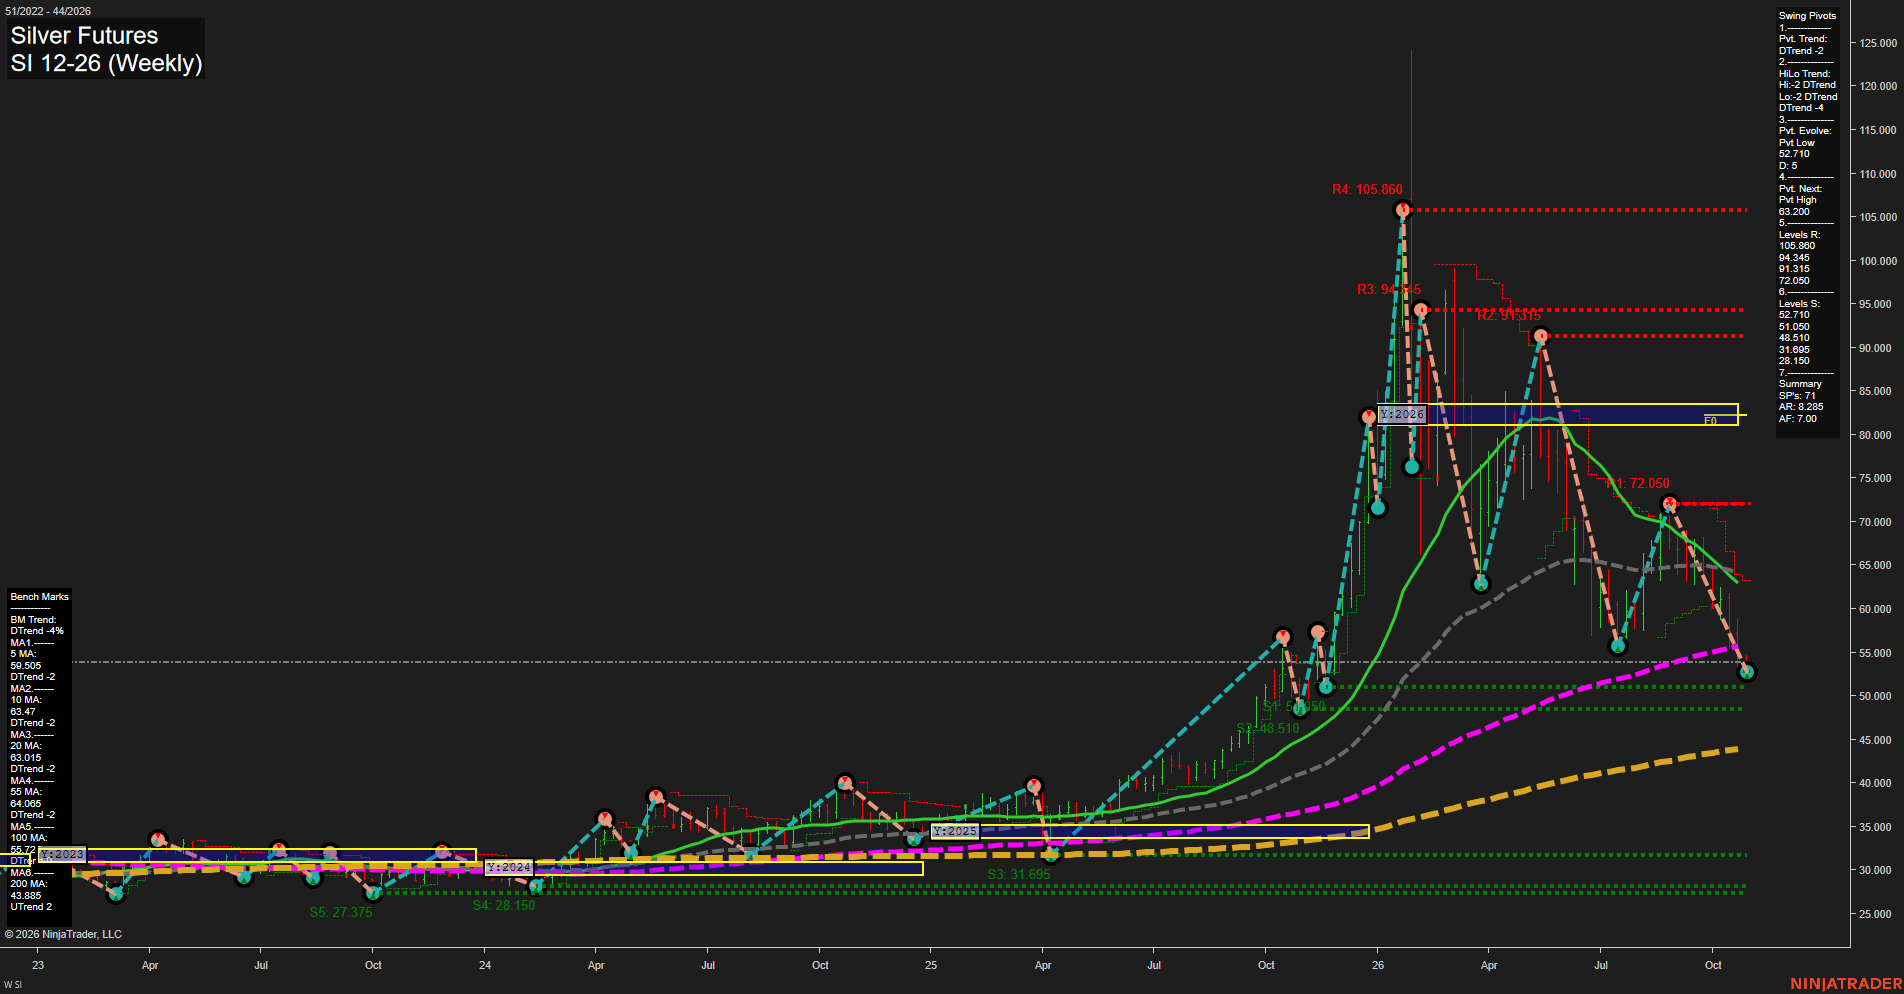
SI Silver Futures Weekly Chart Analysis: 2026-Oct-28 07:10 CT
Price Action
- Last: 52.710,
- Bars: Large,
- Mom: Fast.
WSFG Weekly
- Short-Term
- WSFG Current: -8%
- F0%/NTZ' Bias: Price Below,
- WSFG Trend: Down.
MSFG Month Oct
- Intermediate-Term
- MSFG Current: -86%
- F0%/NTZ' Bias: Price Below,
- MSFG Trend: Down.
YSFG Year 2026
- Long-Term
- YSFG Current: -236%
- F0%/NTZ' Bias: Price Below,
- YSFG Trend: Down.
Swing Pivots
- (Short-Term) 1. Pvt. Trend: DTrend,
- (Intermediate-Term) 2. HiLo Trend: DTrend,
- 3. Pvt. Evolve: Pvt low 52.710,
- 4. Pvt. Next: Pvt high 63.200,
- 5. Levels R: 105.860, 94.345, 91.315, 72.050,
- 6. Levels S: 52.710, 51.050, 48.510, 31.695, 28.150, 27.375.
Weekly Benchmarks
- (Short-Term) 5 Day: 59.505 Down Trend,
- (Short-Term) 10 Day: 63.470 Down Trend,
- (Intermediate-Term) 20 Day: 63.015 Down Trend,
- (Intermediate-Term) 55 Day: 64.065 Down Trend,
- (Long-Term) 100 Day: 55.720 Up Trend,
- (Long-Term) 200 Day: 43.895 Up Trend.
Recent Trade Signals
- 27 Oct 2026: Short SI 12-26 @ 52.85 Signals.USAR-WSFG
- 22 Oct 2026: Short SI 12-26 @ 56.35 Signals.USAR.TR120
Overall Rating
- Short-Term: Bearish,
- Intermediate-Term: Bearish,
- Long-Term: Bearish.
Key Insights Summary
Silver remains in a sharp weekly corrective decline following the earlier parabolic advance and rejection from the 105.860 pivot high. Price is beneath the short- and intermediate-term benchmark cluster, while both weekly and monthly Fib-grid structures remain below their F0%/NTZ areas. The pivot sequence remains bearish, with lower highs and lower lows defining the active structure. The 52.710 pivot low is the immediate focal level, followed by supports at 51.050 and 48.510; 63.200 is the first pivot-reversal threshold. Long-term moving averages remain upward sloping, but the yearly grid and current price structure characterize the present phase as a deep bearish retracement within that broader historical advance.
Chart Analysis ATS AI Generated: 2026-10-28 07:10 for Informational use only, not trading advice. Terms and Risk Disclosure Copyright © 2026. Algo Trading Systems LLC.