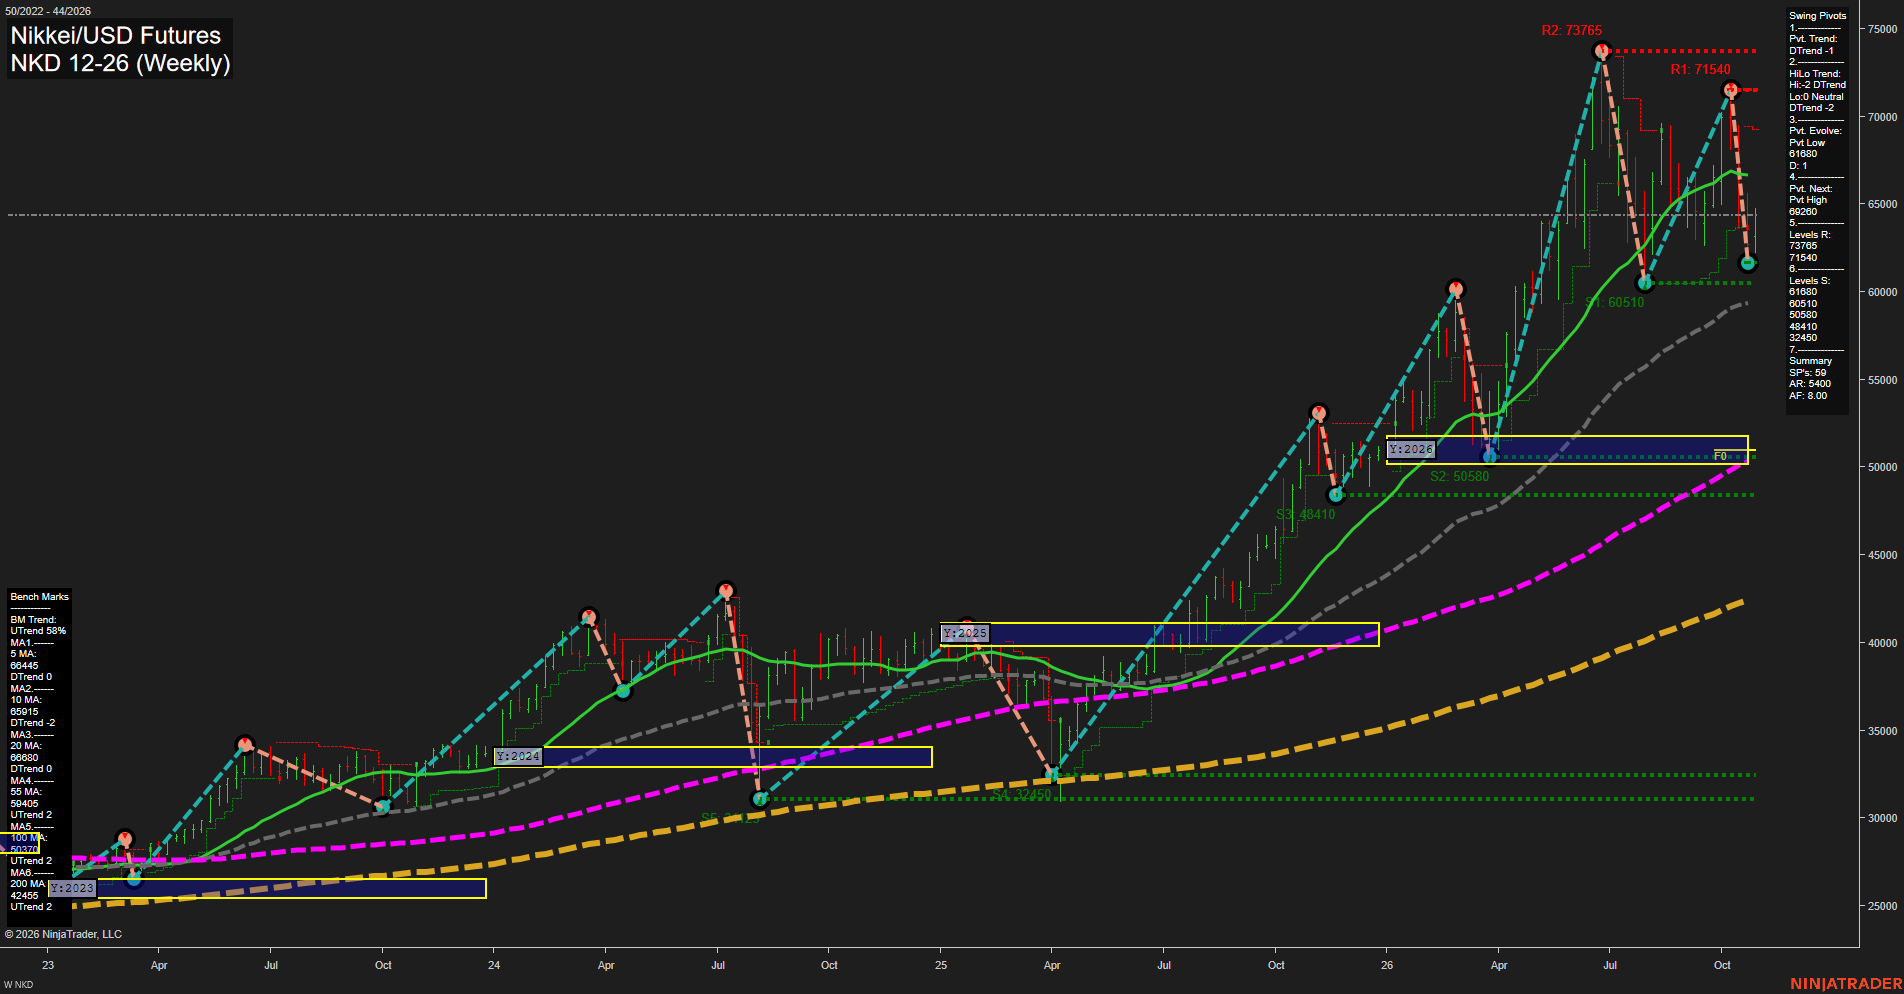
NKD Nikkei/USD Futures Weekly Chart Analysis: 2026-Oct-28 07:07 CT
Price Action
- Last: 64425,
- Bars: Medium,
- Mom: average.
WSFG Weekly
- Short-Term
- WSFG Current: 36%
- F0%/NTZ' Bias: Price Above,
- WSFG Trend: Up.
MSFG Month Oct
- Intermediate-Term
- MSFG Current: -66%
- F0%/NTZ' Bias: Price Below,
- MSFG Trend: Down.
YSFG Year 2026
- Long-Term
- YSFG Current: 165%
- F0%/NTZ' Bias: Price Above,
- YSFG Trend: Up.
Swing Pivots
- (Short-Term) 1. Pvt. Trend: DTrend,
- (Intermediate-Term) 2. HiLo Trend: DTrend,
- 3. Pvt. Evolve: Pvt low 61680,
- 4. Pvt. Next: Pvt high 69260,
- 5. Levels R: 73765, 71540,
- 6. Levels S: 61680, 60510, 50580, 48410, 32450, 30445.
Weekly Benchmarks
- (Short-Term) 5 Day: 64445 Down Trend,
- (Short-Term) 10 Day: 65915 Down Trend,
- (Intermediate-Term) 20 Day: 66890 Down Trend,
- (Intermediate-Term) 55 Day: 59545 Up Trend,
- (Long-Term) 100 Day: 50370 Up Trend,
- (Long-Term) 200 Day: 42450 Up Trend.
Recent Trade Signals
- 27 Oct 2026: Long NKD 12-26 @ 64500 Signals.USAR-WSFG
- 27 Oct 2026: Long NKD 12-26 @ 63820 Signals.USAR.TR120
Overall Rating
- Short-Term: Bearish,
- Intermediate-Term: Bearish,
- Long-Term: Bullish.
Key Insights Summary
Weekly price remains above the yearly F0% structure and well above the rising 55, 100, and 200 period benchmarks, preserving the larger secular uptrend. Short-term structure is corrective: price is below the declining 10 and 20 period averages, while pivot trend and HiLo trend remain down. The 61680 pivot low is the immediate swing reference, with 69260 defining the reversal threshold for a new pivot high. The market is consolidating after rejection from 71540, with 60510 and the 50580 yearly-grid support zone defining progressively deeper retracement structure.
Chart Analysis ATS AI Generated: 2026-10-28 07:08 for Informational use only, not trading advice. Terms and Risk Disclosure Copyright © 2026. Algo Trading Systems LLC.