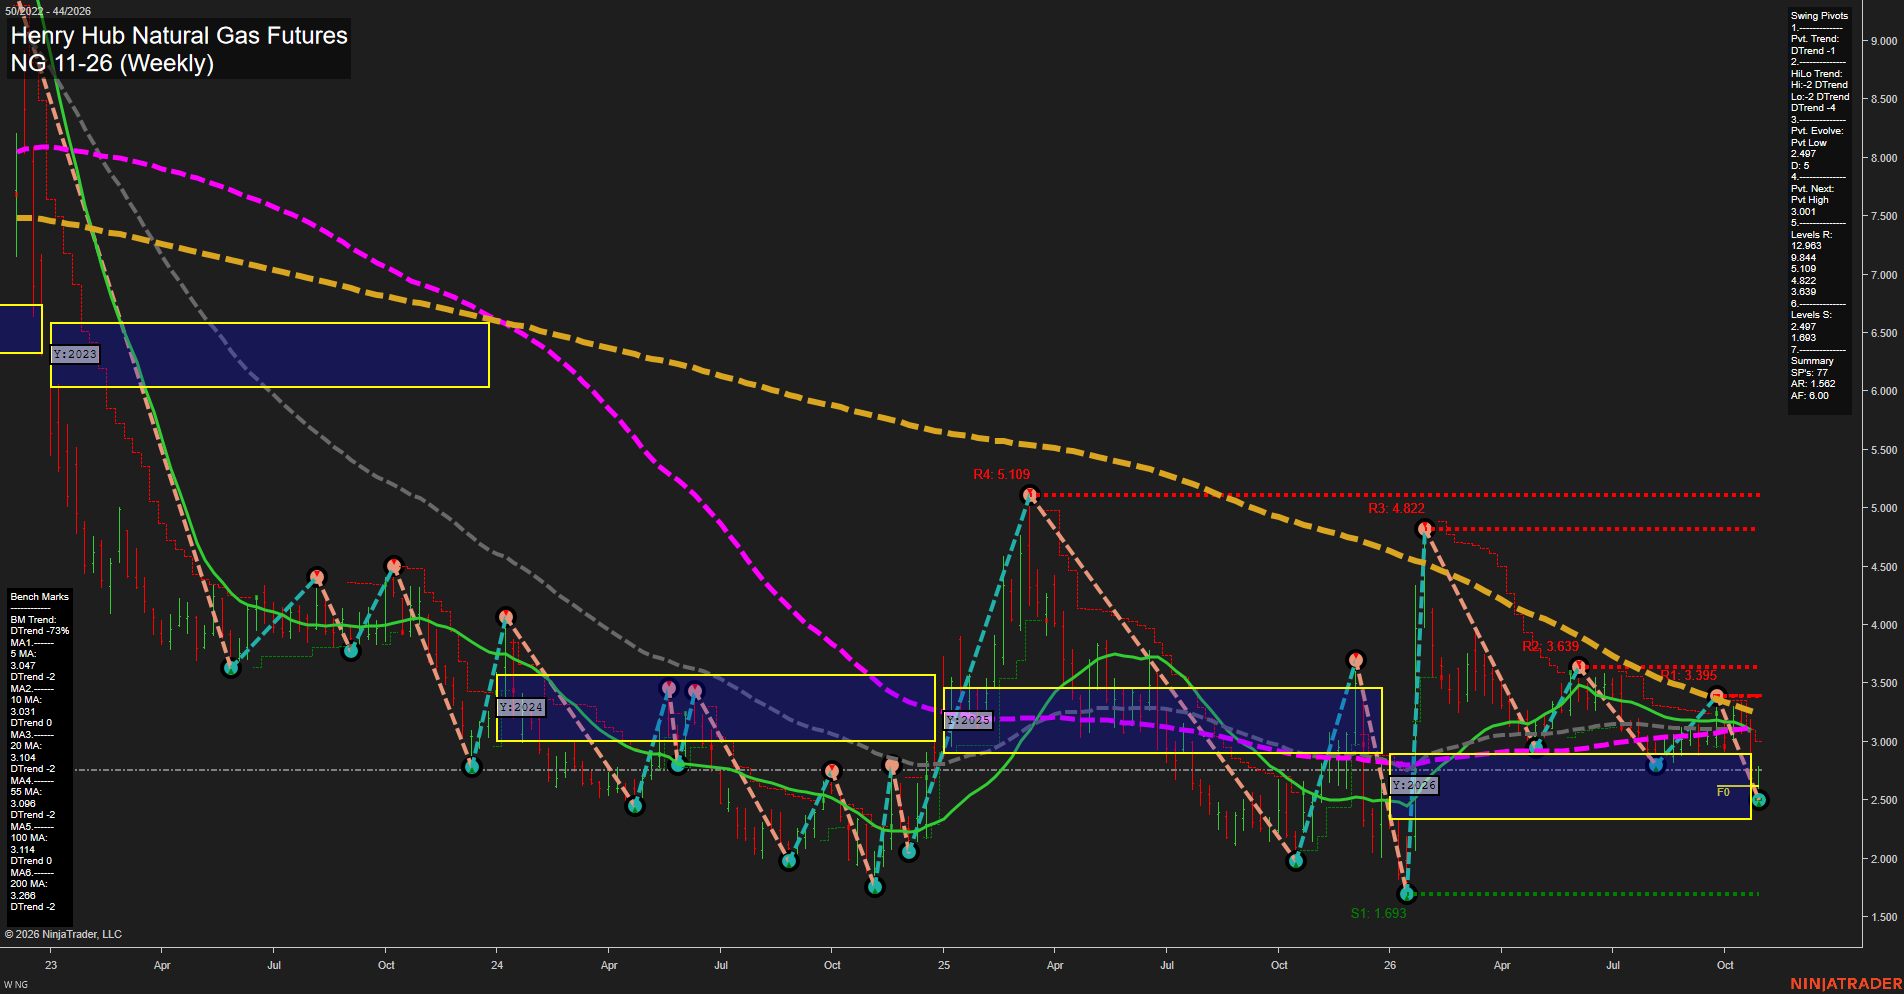
NG Henry Hub Natural Gas Futures Weekly Chart Analysis: 2026-Oct-28 07:07 CT
Price Action
- Last: 2.963,
- Bars: Large,
- Mom: fast.
WSFG Weekly
- Short-Term
- WSFG Current: -78%
- F0%/NTZ' Bias: Price Below,
- WSFG Trend: Down.
MSFG Month Oct
- Intermediate-Term
- MSFG Current: -32%
- F0%/NTZ' Bias: Price Below,
- MSFG Trend: Down.
YSFG Year 2026
- Long-Term
- YSFG Current: 8%
- F0%/NTZ' Bias: Price Above,
- YSFG Trend: Up.
Swing Pivots
- (Short-Term) 1. Pvt. Trend: DTrend,
- (Intermediate-Term) 2. HiLo Trend: DTrend,
- 3. Pvt. Evolve: Pvt low 2.497,
- 4. Pvt. Next: Pvt high 3.001,
- 5. Levels R: 12.963, 9.844, 5.109, 4.822, 3.639,
- 6. Levels S: 2.497, 1.693.
Weekly Benchmarks
- (Short-Term) 5 Day: 3.047 Down Trend,
- (Short-Term) 10 Day: 3.031 Down Trend,
- (Intermediate-Term) 20 Day: 3.104 Down Trend,
- (Intermediate-Term) 55 Day: 3.096 Down Trend,
- (Long-Term) 100 Day: 3.114 Down Trend,
- (Long-Term) 200 Day: 3.268 Down Trend.
Recent Trade Signals
- 27 Oct 2026: Long NG 12-26 @ 3.029 Signals.USAR.TR120
- 26 Oct 2026: Long NG 12-26 @ 3.046 Signals.USAR-MSFG
Overall Rating
- Short-Term: Bearish,
- Intermediate-Term: Bearish,
- Long-Term: Neutral.
Key Insights Summary
NG is in a fast weekly selloff with price beneath the weekly and monthly Fib centers, below every benchmark average, and maintaining lower swing structure. The 2.497 evolving pivot low is the immediate structural support, while 3.001 is the nearest pivot-reversal threshold; the 3.047-3.114 moving-average cluster and 3.639 resistance define overhead supply. The yearly grid remains marginally positive, creating a longer-cycle countertrend backdrop within a broadly bearish weekly and intermediate-term technical condition.
Chart Analysis ATS AI Generated: 2026-10-28 07:07 for Informational use only, not trading advice. Terms and Risk Disclosure Copyright © 2026. Algo Trading Systems LLC.