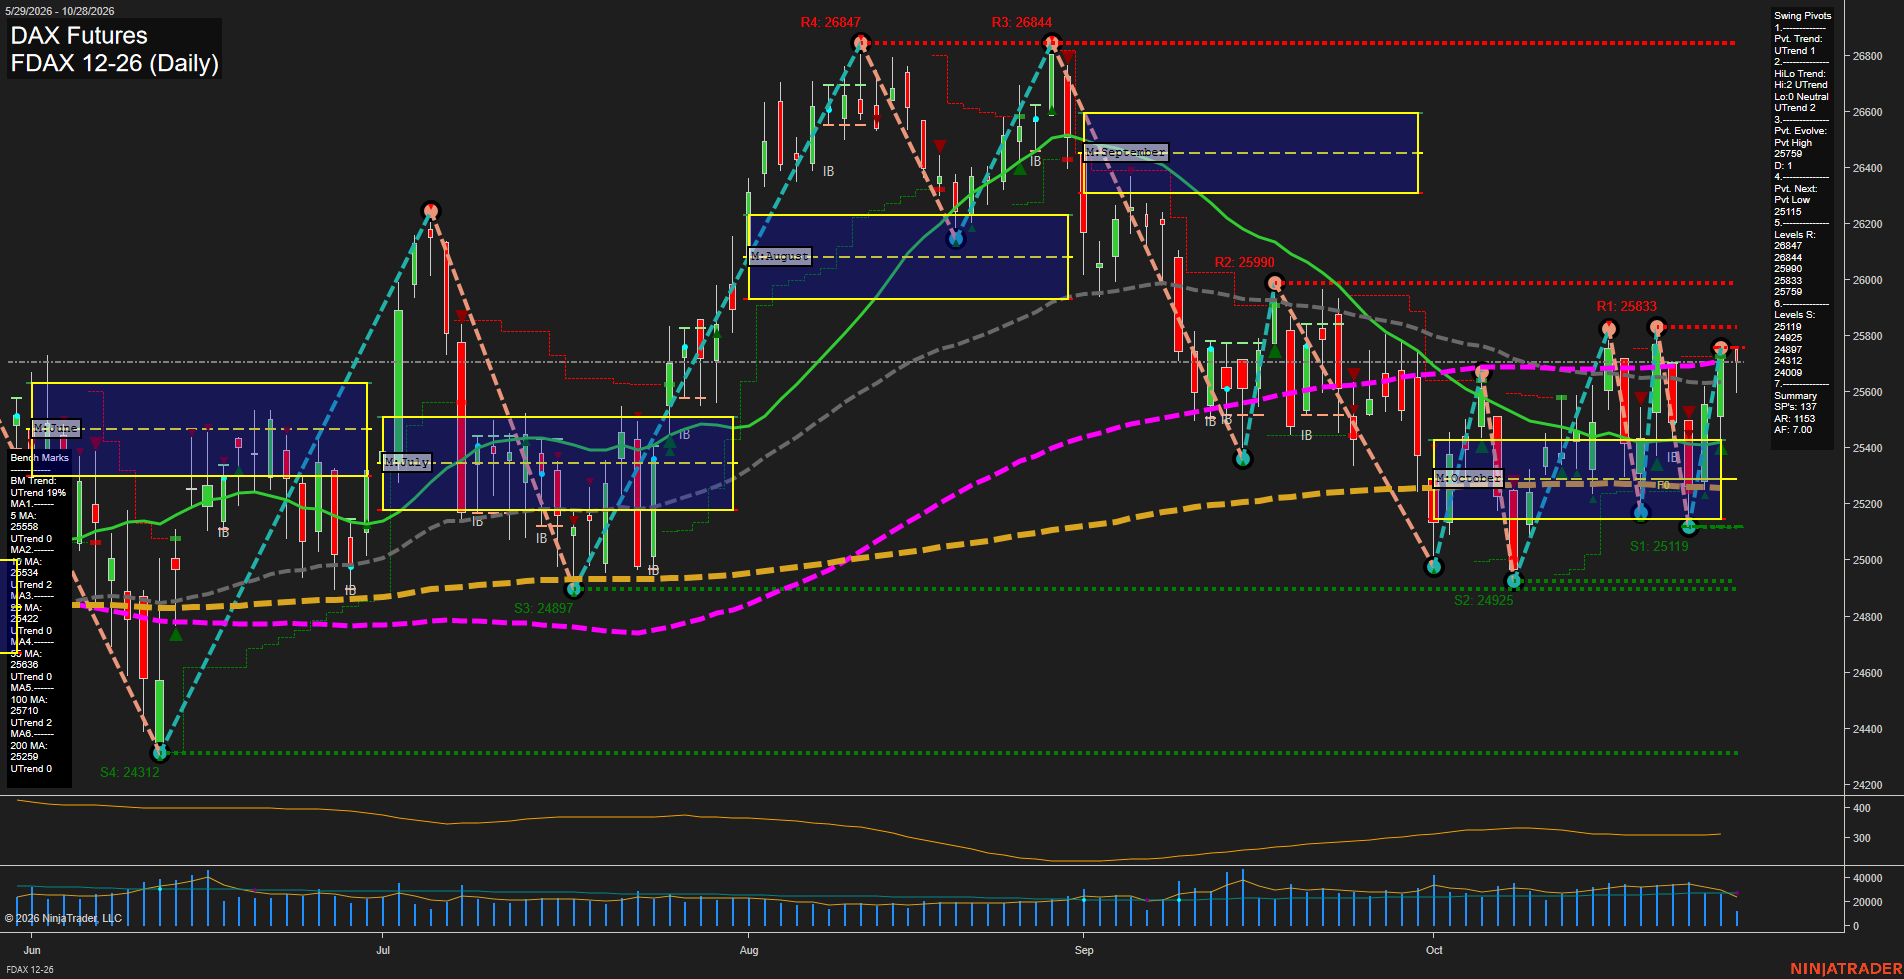
FDAX DAX Futures Daily Chart Analysis: 2026-Oct-28 07:05 CT
Price Action
- Last: 25739,
- Bars: Medium,
- Mom: Average.
WSFG Weekly
- Short-Term
- WSFG Current: 50%
- F0%/NTZ' Bias: Price Above,
- WSFG Trend: Up.
MSFG Month Oct
- Intermediate-Term
- MSFG Current: 53%
- F0%/NTZ' Bias: Price Above,
- MSFG Trend: Up.
YSFG Year 2026
- Long-Term
- YSFG Current: 18%
- F0%/NTZ' Bias: Price Above,
- YSFG Trend: Up.
Swing Pivots
- (Short-Term) 1. Pvt. Trend: UTrend,
- (Intermediate-Term) 2. HiLo Trend: UTrend,
- 3. Pvt. Evolve: Pvt high 25759,
- 4. Pvt. Next: Pvt low 25115,
- 5. Levels R: 26847, 26844, 25890, 25833, 25759,
- 6. Levels S: 25119, 24925, 24897, 24312, 24009.
Daily Benchmarks
- (Short-Term) 5 Day: 25558 Up Trend,
- (Short-Term) 10 Day: 25345 Up Trend,
- (Intermediate-Term) 20 Day: 25442 Up Trend,
- (Intermediate-Term) 55 Day: 25630 Up Trend,
- (Long-Term) 100 Day: 25710 Up Trend,
- (Long-Term) 200 Day: 25259 Up Trend.
Additional Metrics
Recent Trade Signals
- 27 Oct 2026: Long FDAX 12-26 @ 25690 Signals.USAR-WSFG
- 27 Oct 2026: Long FDAX 12-26 @ 25576 Signals.USAR.TR120
Overall Rating
- Short-Term: Bullish,
- Intermediate-Term: Bullish,
- Long-Term: Bullish.
Key Insights Summary
FDAX is maintaining a broad bullish swing structure, with price above the weekly, monthly, and yearly F0% zones and above all six rising benchmark averages. The short-term pivot trend remains upward, although the latest pivot-high evolution at 25759 shows the market is testing nearby resistance at 25759, 25833, and 25890. The intermediate pivot structure remains constructive through higher swing lows, while 25119 and 24925 define the nearest meaningful support band. Price action has recovered from the October pullback and is consolidating near the upper portion of the recent range, with average momentum and moderate daily volatility.
Chart Analysis ATS AI Generated: 2026-10-28 07:05 for Informational use only, not trading advice. Terms and Risk Disclosure Copyright © 2026. Algo Trading Systems LLC.