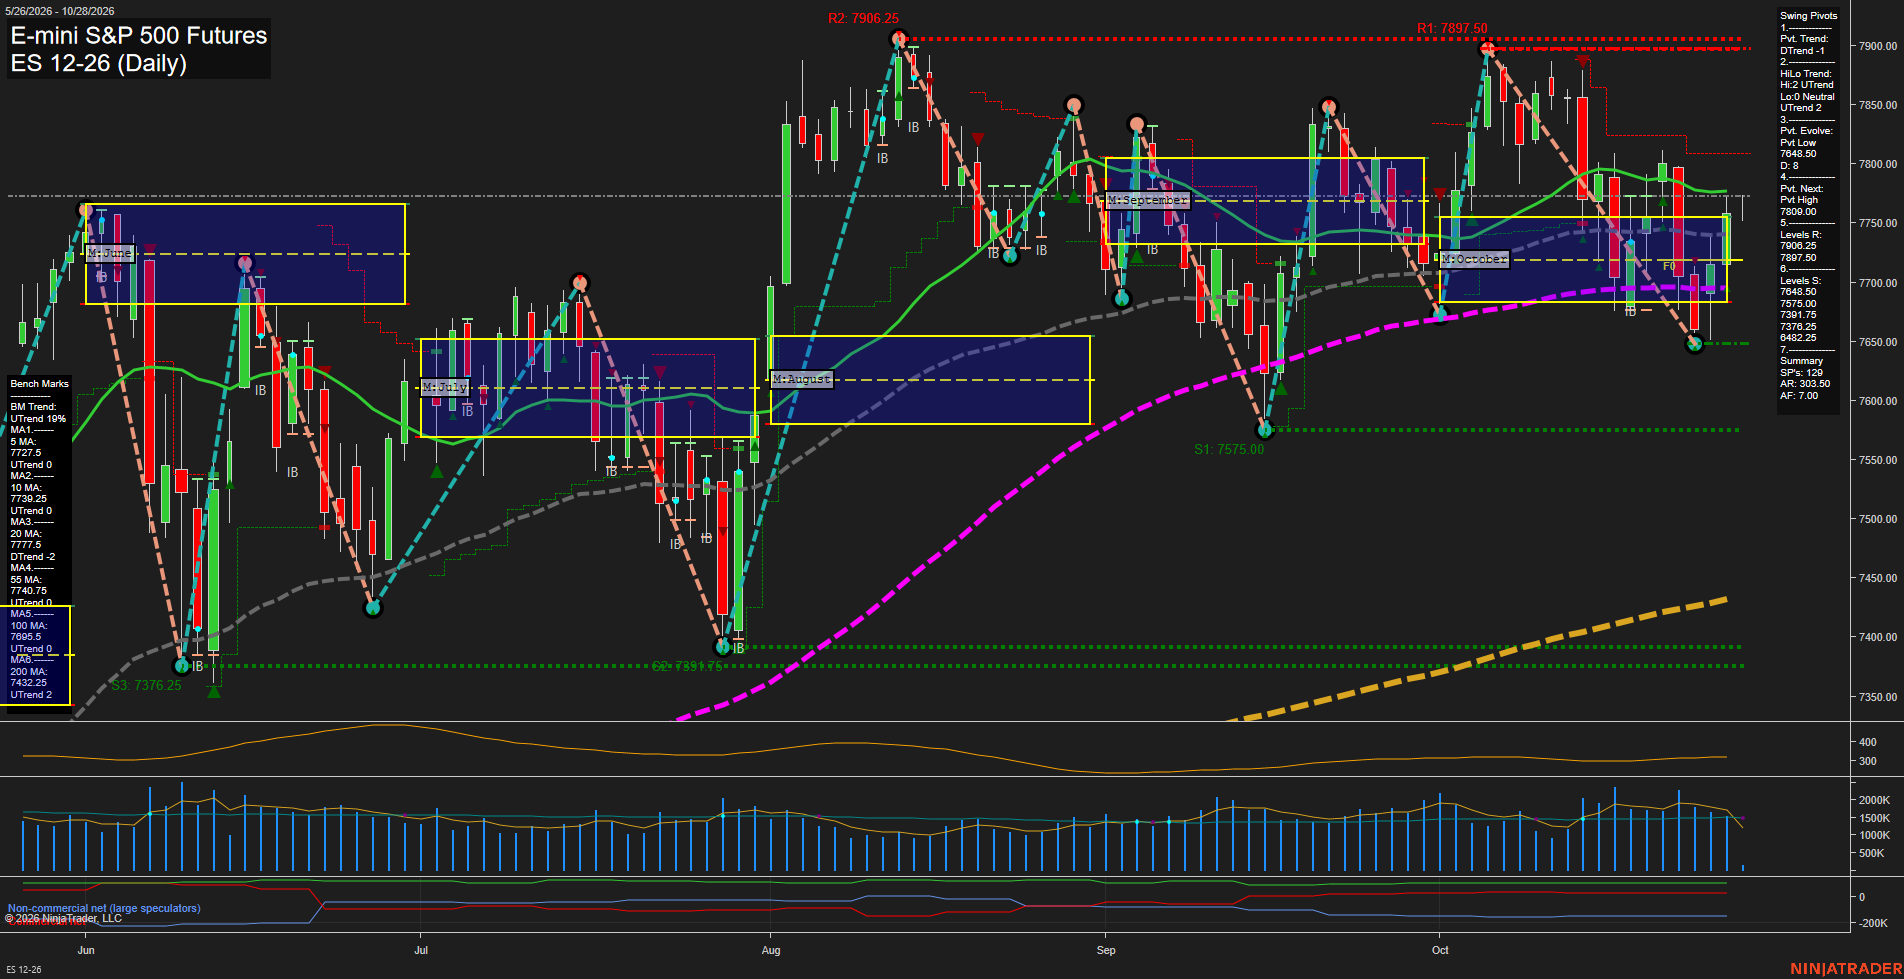
ES E-mini S&P 500 Futures Daily Chart Analysis: 2026-Oct-28 07:04 CT
Price Action
- Last: 7717.25,
- Bars: Small,
- Mom: slow.
WSFG Weekly
- Short-Term
- WSFG Current: 57%
- F0%/NTZ' Bias: Price Above,
- WSFG Trend: Up.
MSFG Month Oct
- Intermediate-Term
- MSFG Current: 10%
- F0%/NTZ' Bias: Price Above,
- MSFG Trend: Up.
YSFG Year 2026
- Long-Term
- YSFG Current: 60%
- F0%/NTZ' Bias: Price Above,
- YSFG Trend: Up.
Swing Pivots
- (Short-Term) 1. Pvt. Trend: DTrend,
- (Intermediate-Term) 2. HiLo Trend: UTrend,
- 3. Pvt. Evolve: Pvt low 7648.50,
- 4. Pvt. Next: Pvt high 7809.00,
- 5. Levels R: 7906.25, 7897.50,
- 6. Levels S: 7648.50, 7575.00, 7391.75, 7376.25, 6848.25.
Daily Benchmarks
- (Short-Term) 5 Day: 7727.50 Up Trend,
- (Short-Term) 10 Day: 7739.25 Up Trend,
- (Intermediate-Term) 20 Day: 7777.50 Down Trend,
- (Intermediate-Term) 55 Day: 7740.75 Up Trend,
- (Long-Term) 100 Day: 7695.00 Up Trend,
- (Long-Term) 200 Day: 7432.25 Up Trend.
Additional Metrics
- ATR: 319,
- VOLMA: 1611996.
Recent Trade Signals
- 27 Oct 2026: Long ES 12-26 @ 7768 Signals.USAR.TR120
- 27 Oct 2026: Long ES 12-26 @ 7768 Signals.USAR-WSFG
- 27 Oct 2026: Short ES 12-26 @ 7717.25 Signals.USAR-MSFG
Overall Rating
- Short-Term: Neutral,
- Intermediate-Term: Bullish,
- Long-Term: Bullish.
Key Insights Summary
The daily structure is consolidative after the October rejection beneath the 7897.50-7906.25 resistance band. Short-term pivots remain in a DTrend and price is below the 5, 10, 20, and 55 day benchmark area, reflecting a slow pullback rather than impulsive downside momentum. The intermediate HiLo trend, monthly grid, and longer benchmark alignment remain constructive, with 7648.50 defining the key recent higher-low pivot and 7695.00 providing nearby long-term moving-average support. Volatility remains elevated on the ATR measure, while recent smaller bars indicate compression following the sharp October swings.
Chart Analysis ATS AI Generated: 2026-10-28 07:04 for Informational use only, not trading advice. Terms and Risk Disclosure Copyright © 2026. Algo Trading Systems LLC.