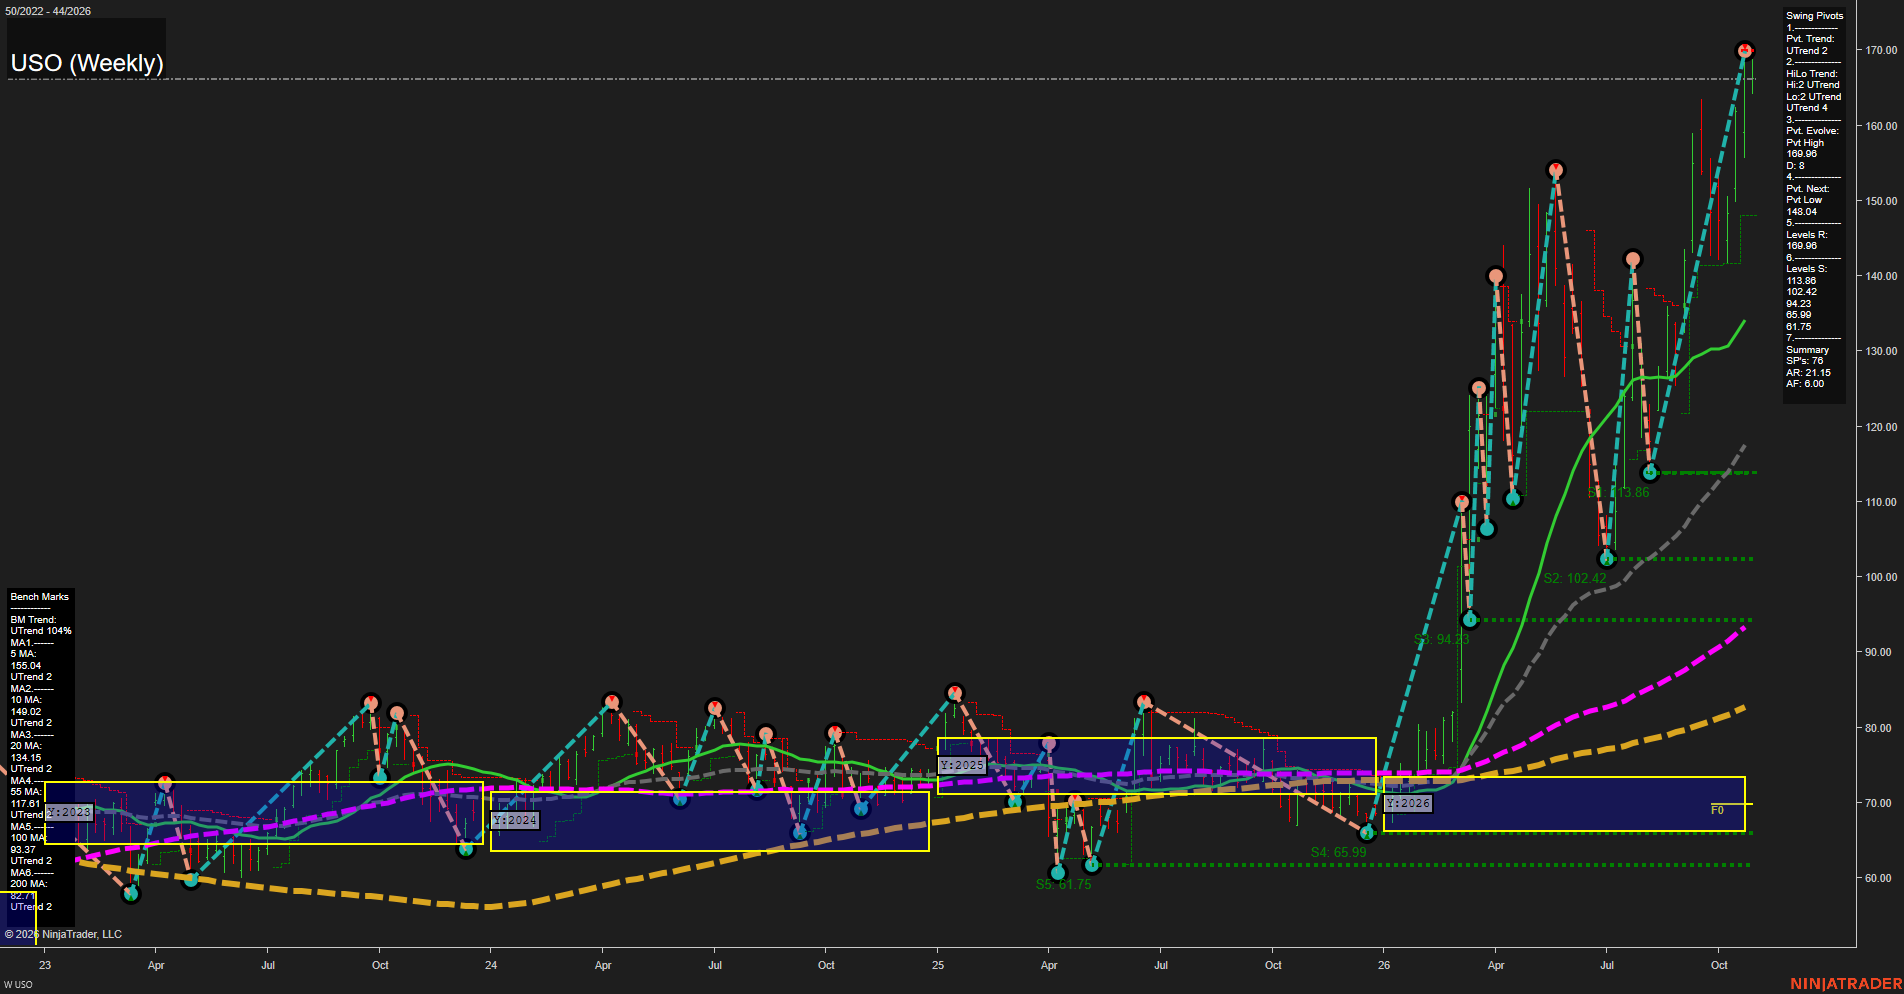
USO United States Oil Fund LP Weekly Chart Analysis: 2026-Oct-27 07:10 CT
Price Action
- Last: 167.00,
- Bars: Large,
- Mom: fast.
WSFG Weekly
- Short-Term
- WSFG Current: NA%
- F0%/NTZ' Bias: Price Neutral,
- WSFG Trend: Neutral.
MSFG Month Oct
- Intermediate-Term
- MSFG Current: NA%
- F0%/NTZ' Bias: Price Neutral,
- MSFG Trend: Neutral.
YSFG Year 2026
- Long-Term
- YSFG Current: NA%
- F0%/NTZ' Bias: Price Above NTZ Upper,
- YSFG Trend: Bullish.
Swing Pivots
- (Short-Term) 1. Pvt. Trend: UTrend,
- (Intermediate-Term) 2. HiLo Trend: UTrend,
- 3. Pvt. Evolve: Pvt high 169.98,
- 4. Pvt. Next: Pvt low 148.04,
- 5. Levels R: 169.98,
- 6. Levels S: 113.86, 102.42, 94.23, 65.99, 61.75.
Weekly Benchmarks
- (Short-Term) 5 Day: 155.04 Up Trend,
- (Short-Term) 10 Day: 149.02 Up Trend,
- (Intermediate-Term) 20 Day: 134.15 Up Trend,
- (Intermediate-Term) 55 Day: 117.81 Up Trend,
- (Long-Term) 100 Day: 93.37 Up Trend,
- (Long-Term) 200 Day: 82.71 Up Trend.
Overall Rating
- Short-Term: Bullish,
- Intermediate-Term: Bullish,
- Long-Term: Bullish.
Key Insights Summary
USO displays a powerful futures-style momentum expansion, with price advancing sharply above every rising benchmark and far above the 2026 yearly NTZ. The swing structure remains constructive: the active pivot is a 169.98 high, the short-term and intermediate-term pivot trends are both UTrend, and 148.04 defines the next opposite-pivot reversal level. The move is extended and volatile after a near-vertical advance, with 169.98 representing the immediate breakout and rejection reference. Beneath price, 155.04 and 149.02 are the closest short-term trend references, while 134.15 and 117.81 frame the broader continuation structure. From a futures swing-trader perspective, the chart reflects an accelerating bullish price cycle marked by higher highs, higher lows, expanding range, and strong trend alignment across weekly moving averages.
Chart Analysis ATS AI Generated: 2026-10-27 07:10 for Informational use only, not trading advice. Terms and Risk Disclosure Copyright © 2026. Algo Trading Systems LLC.