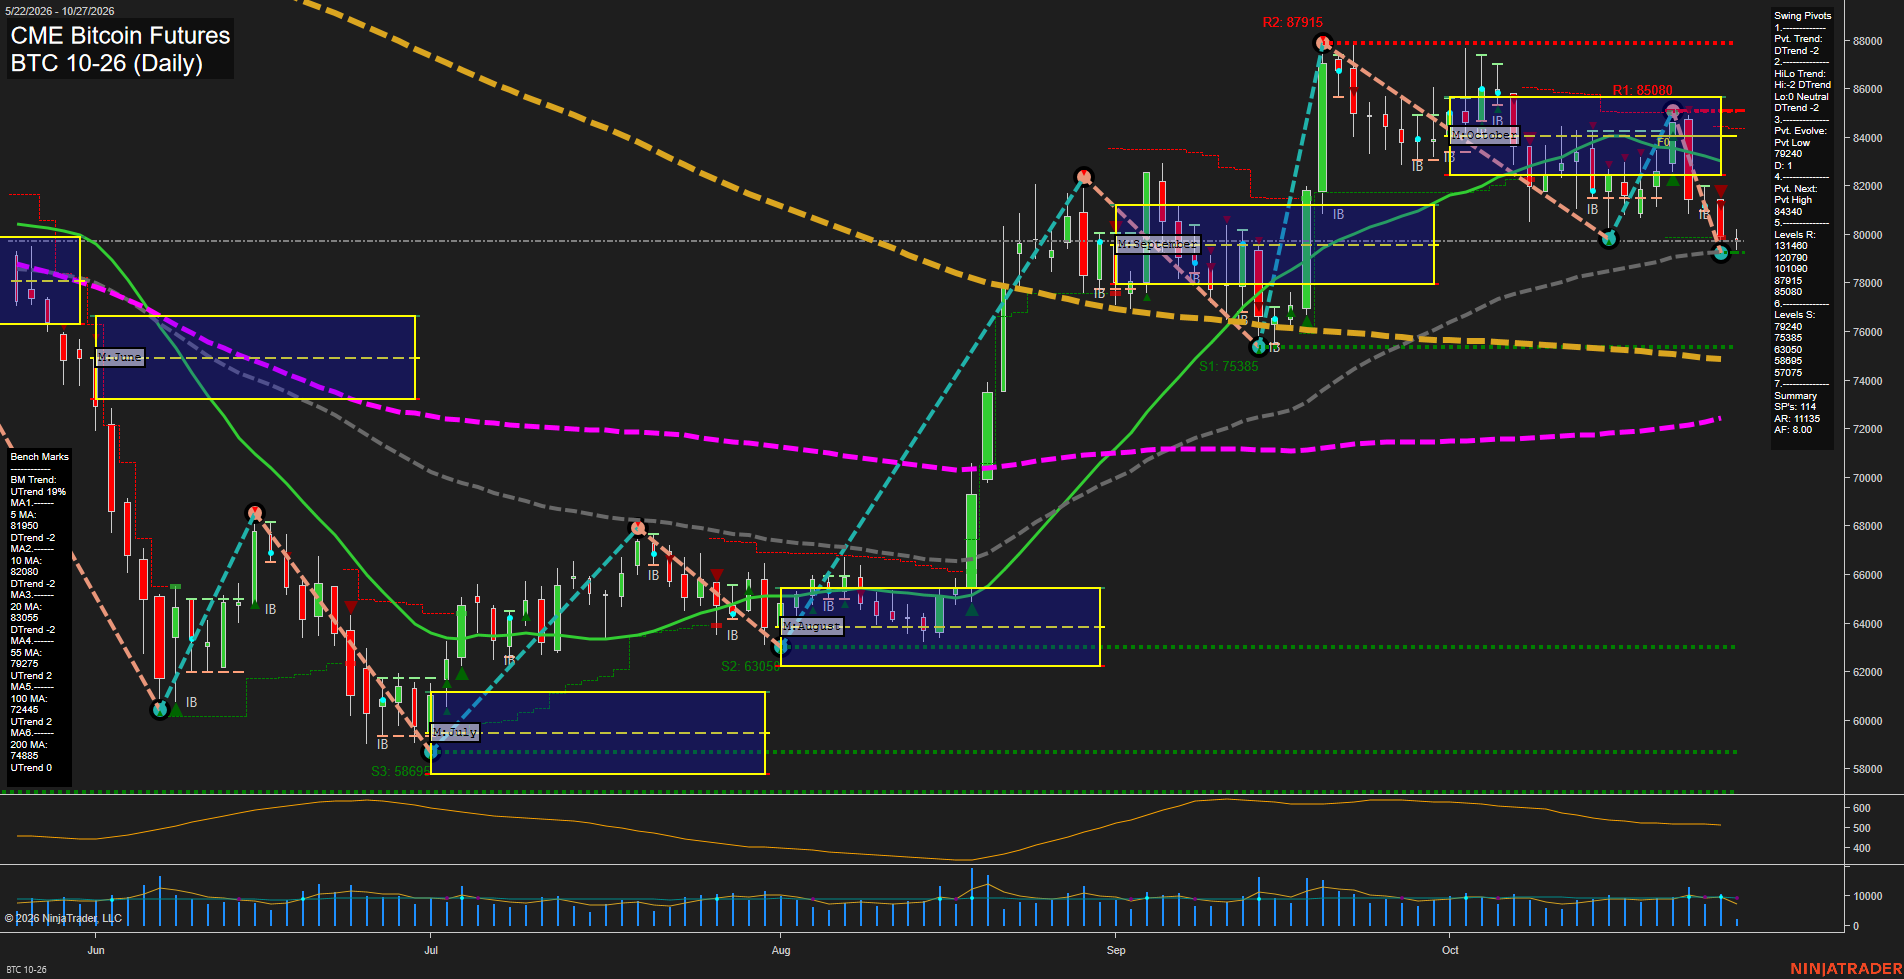
BTC CME Bitcoin Futures Daily Chart Analysis: 2026-Oct-27 07:01 CT
Price Action
- Last: 79425,
- Bars: Small,
- Mom: slow.
WSFG Weekly
- Short-Term
- WSFG Current: -6%
- F0%/NTZ' Bias: Price Below,
- WSFG Trend: Down.
MSFG Month Oct
- Intermediate-Term
- MSFG Current: -33%
- F0%/NTZ' Bias: Price Below,
- MSFG Trend: Down.
YSFG Year 2026
- Long-Term
- YSFG Current: -39%
- F0%/NTZ' Bias: Price Below,
- YSFG Trend: Down.
Swing Pivots
- (Short-Term) 1. Pvt. Trend: DTrend,
- (Intermediate-Term) 2. HiLo Trend: DTrend,
- 3. Pvt. Evolve: Pvt low 79255,
- 4. Pvt. Next: Pvt high 84340,
- 5. Levels R: 131995, 120790, 101090, 87910, 85080,
- 6. Levels S: 79240, 75385, 63050, 58895, 57075.
Daily Benchmarks
- (Short-Term) 5 Day: 81950 Down Trend,
- (Short-Term) 10 Day: 82080 Down Trend,
- (Intermediate-Term) 20 Day: 83055 Down Trend,
- (Intermediate-Term) 55 Day: 79275 Up Trend,
- (Long-Term) 100 Day: 72445 Up Trend,
- (Long-Term) 200 Day: 74885 Up Trend.
Additional Metrics
Recent Trade Signals
- 27 Oct 2026: Short BTC 10-26 @ 79450 Signals.USAR-WSFG
- 23 Oct 2026: Short BTC 10-26 @ 81735 Signals.USAR-MSFG
- 22 Oct 2026: Short BTC 10-26 @ 82785 Signals.USAR.TR120
Overall Rating
- Short-Term: Bearish,
- Intermediate-Term: Bearish,
- Long-Term: Bullish.
Key Insights Summary
Price is pressing the 79,240-79,255 pivot-support area after a lower-high rejection from the 85,080 region. Short-term pivot structure, weekly and monthly Fib-grid readings, and the 5-, 10-, and 20-day benchmarks remain aligned lower. The 55-day average is near current price while the rising 100- and 200-day averages preserve a constructive longer-term base; a decisive loss of current support would emphasize the broader pullback, while recovery above the 83,055-84,340 area would weaken the immediate bearish swing structure.
Chart Analysis ATS AI Generated: 2026-10-27 07:02 for Informational use only, not trading advice. Terms and Risk Disclosure Copyright © 2026. Algo Trading Systems LLC.