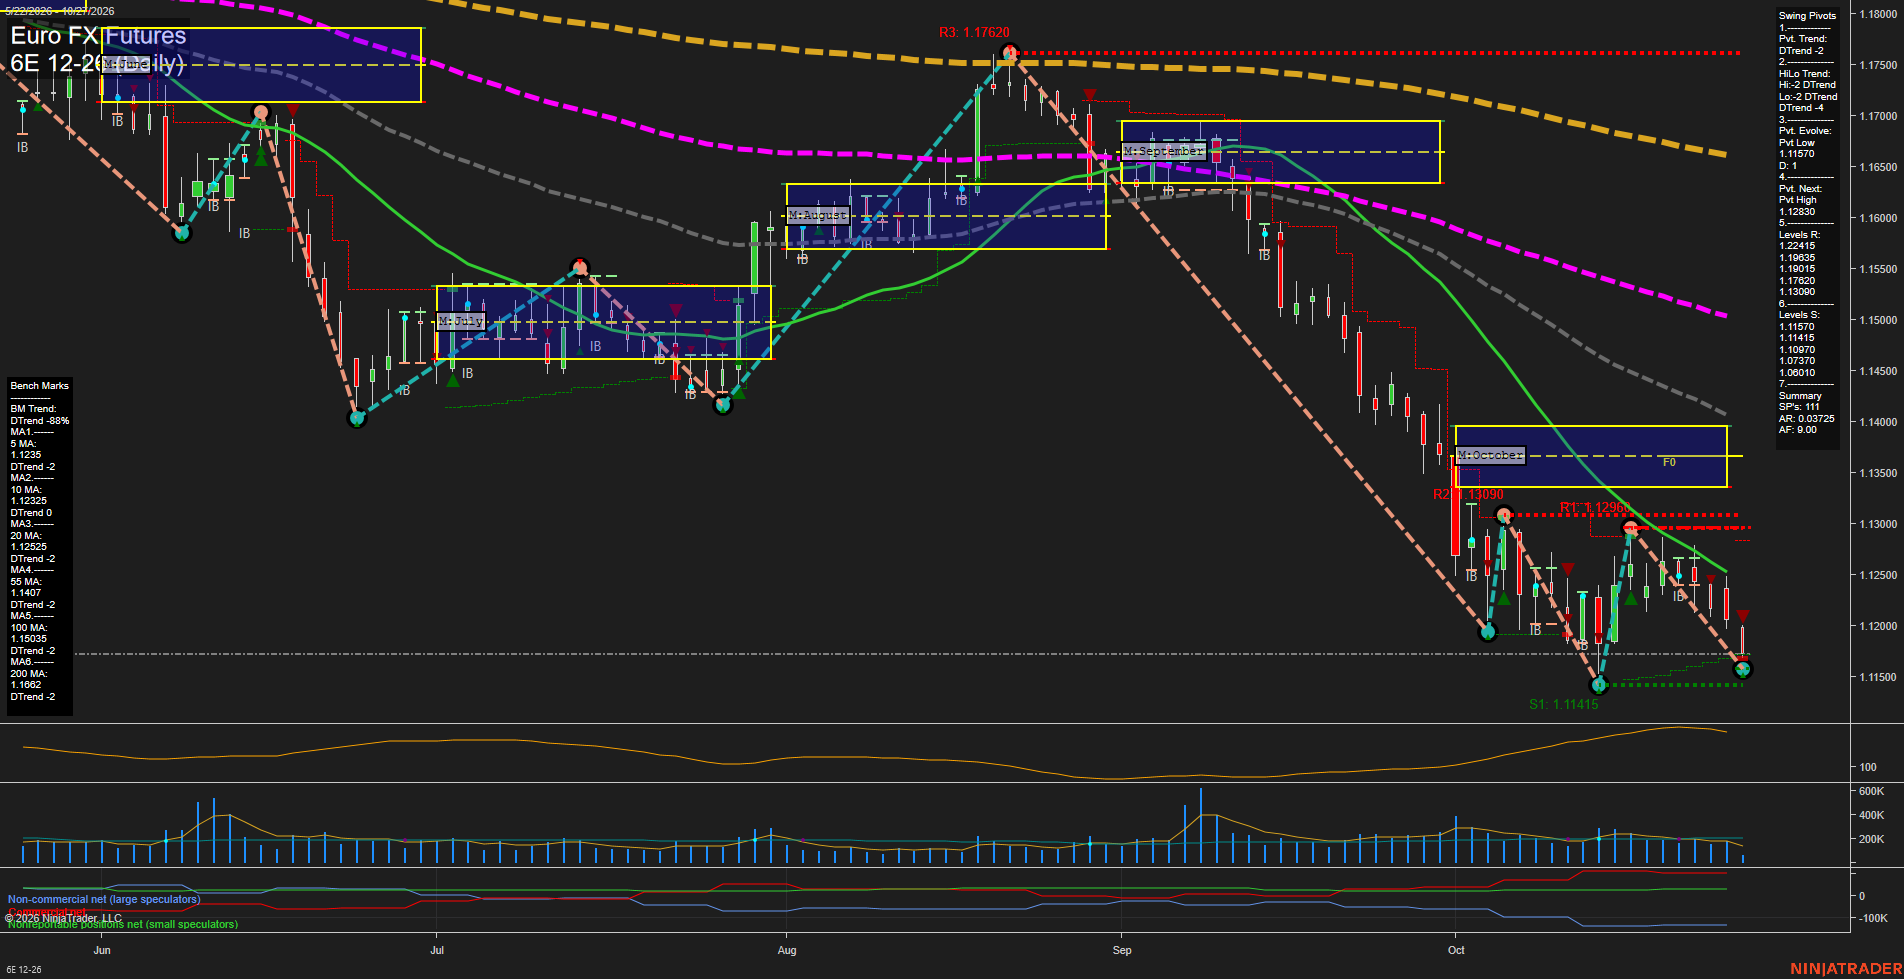
6E Euro FX Futures Daily Chart Analysis: 2026-Oct-27 07:00 CT
Price Action
- Last: 1.11625,
- Bars: Medium,
- Mom: average.
WSFG Weekly
- Short-Term
- WSFG Current: -2%
- F0%/NTZ' Bias: Price Below,
- WSFG Trend: Down.
MSFG Month Oct
- Intermediate-Term
- MSFG Current: -99%
- F0%/NTZ' Bias: Price Below,
- MSFG Trend: Down.
YSFG Year 2026
- Long-Term
- YSFG Current: -61%
- F0%/NTZ' Bias: Price Below,
- YSFG Trend: Down.
Swing Pivots
- (Short-Term) 1. Pvt. Trend: DTrend,
- (Intermediate-Term) 2. HiLo Trend: DTrend,
- 3. Pvt. Evolve: Pvt low 1.11570,
- 4. Pvt. Next: Pvt high 1.12380,
- 5. Levels R: 1.22415, 1.19035, 1.19015, 1.17200, 1.13090,
- 6. Levels S: 1.11570, 1.11415, 1.09700, 1.07370, 1.06400.
Daily Benchmarks
- (Short-Term) 5 Day: 1.12350 Down Trend,
- (Short-Term) 10 Day: 1.12325 Down Trend,
- (Intermediate-Term) 20 Day: 1.12525 Down Trend,
- (Intermediate-Term) 55 Day: 1.14070 Down Trend,
- (Long-Term) 100 Day: 1.15035 Down Trend,
- (Long-Term) 200 Day: 1.16620 Down Trend.
Additional Metrics
Recent Trade Signals
- 27 Oct 2026: Short 6E 12-26 @ 1.11775 Signals.USAR-WSFG
- 22 Oct 2026: Short 6E 12-26 @ 1.1222 Signals.USAR.TR120
Overall Rating
- Short-Term: Bearish,
- Intermediate-Term: Bearish,
- Long-Term: Bearish.
Key Insights Summary
Price remains below every daily benchmark and below the weekly, monthly, and yearly Fib-grid reference zones, defining broad multi-timeframe downside alignment. The pivot structure remains in a DTrend, with the developing low at 1.11570 and nearby support at 1.11415 marking the active downside area. Recent price action is choppy after the October selloff, but rebounds have remained capped beneath the 5-day, 10-day, and 20-day averages near 1.12325-1.12525. The 1.12380 next-pivot threshold and 1.13090 resistance are the principal nearby countertrend reference levels, while a sustained break below the current pivot-low zone would extend the established lower-high/lower-low sequence.
Chart Analysis ATS AI Generated: 2026-10-27 07:01 for Informational use only, not trading advice. Terms and Risk Disclosure Copyright © 2026. Algo Trading Systems LLC.