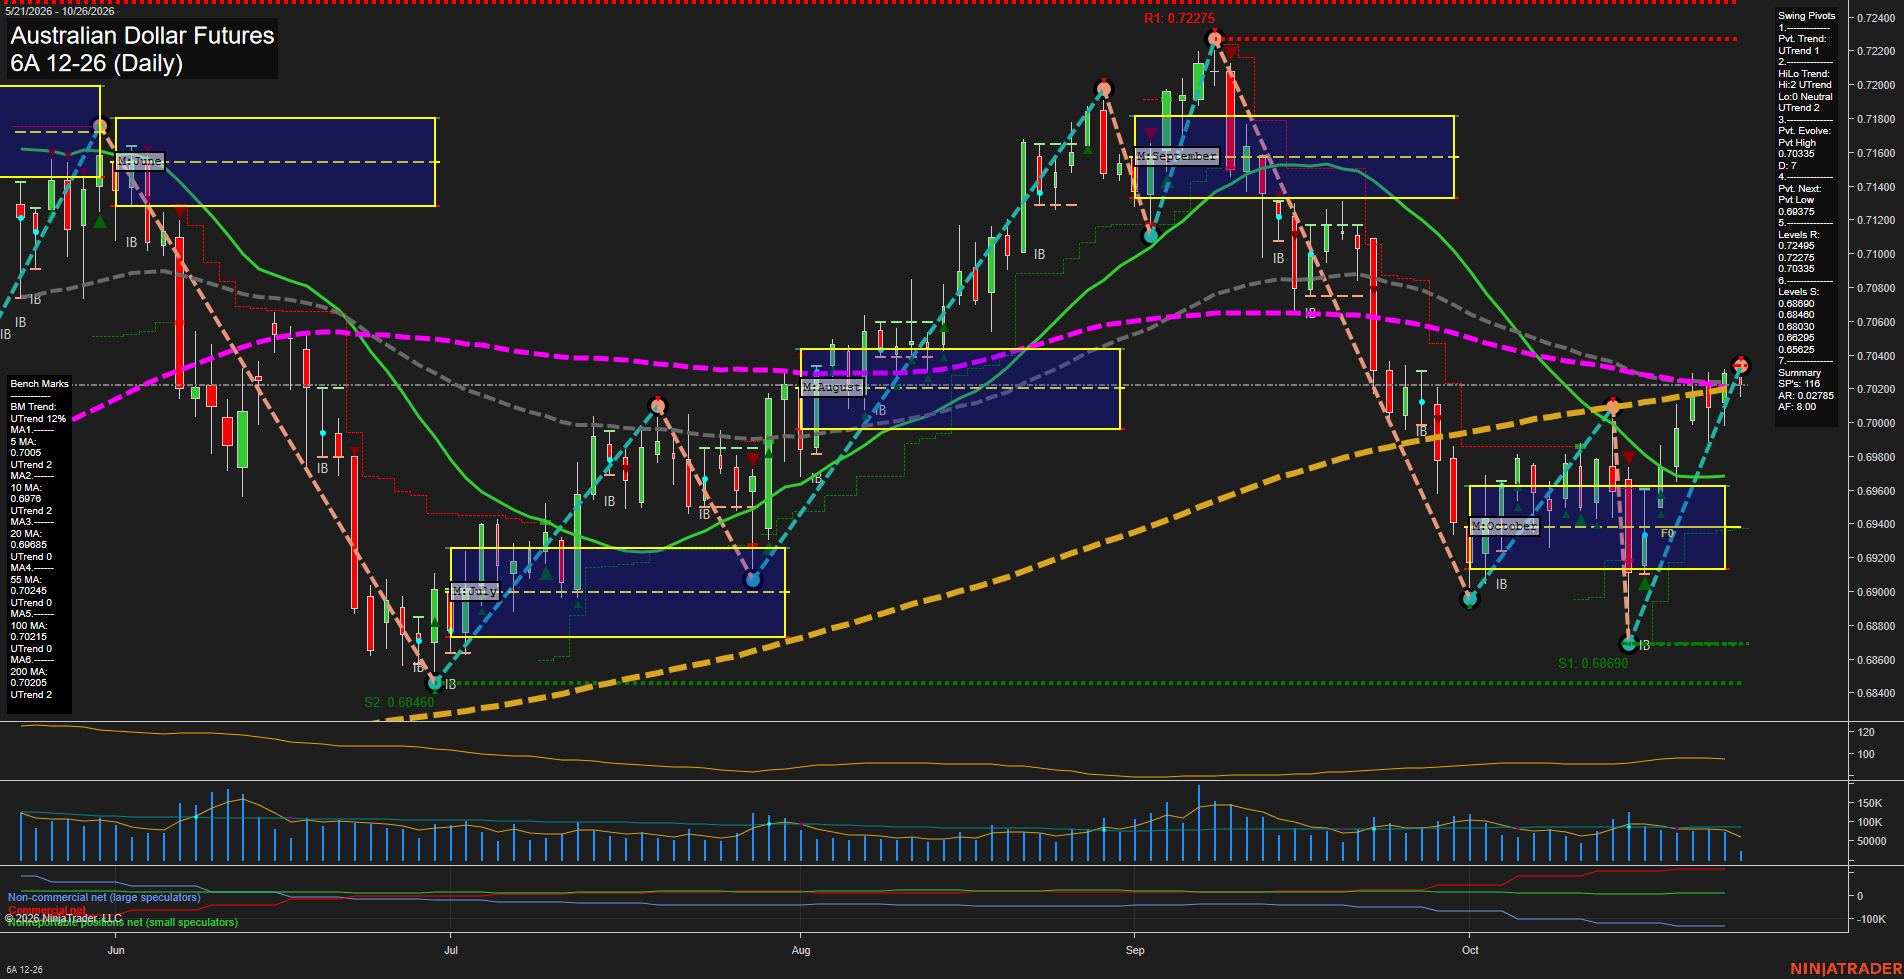
6A Australian Dollar Futures Daily Chart Analysis: 2026-Oct-26 07:00 CT
Price Action
- Last: 0.70335,
- Bars: Medium,
- Mom: Fast.
WSFG Weekly
- Short-Term
- WSFG Current: 57%
- F0%/NTZ' Bias: Price Above,
- WSFG Trend: Up.
MSFG Month Oct
- Intermediate-Term
- MSFG Current: 35%
- F0%/NTZ' Bias: Price Above,
- MSFG Trend: Up.
YSFG Year 2026
- Long-Term
- YSFG Current: 32%
- F0%/NTZ' Bias: Price Above,
- YSFG Trend: Up.
Swing Pivots
- (Short-Term) 1. Pvt. Trend: UTrend,
- (Intermediate-Term) 2. HiLo Trend: UTrend,
- 3. Pvt. Evolve: Pvt high 0.70335,
- 4. Pvt. Next: Pvt low 0.69375,
- 5. Levels R: 0.72495, 0.72275, 0.70335,
- 6. Levels S: 0.68690, 0.68460, 0.68030, 0.66295.
Daily Benchmarks
- (Short-Term) 5 Day: 0.7005 Up Trend,
- (Short-Term) 10 Day: 0.6976 Up Trend,
- (Intermediate-Term) 20 Day: 0.69885 Up Trend,
- (Intermediate-Term) 55 Day: 0.70245 Up Trend,
- (Long-Term) 100 Day: 0.7045 Up Trend,
- (Long-Term) 200 Day: 0.70205 Up Trend.
Additional Metrics
Overall Rating
- Short-Term: Bullish,
- Intermediate-Term: Bullish,
- Long-Term: Bullish.
Key Insights Summary
Price has staged a fast V-shaped recovery from the October low near 0.6870, reclaiming the 5-, 10-, 20-, 55-, and 200-day benchmarks while holding above the October monthly Fib grid. The confirmed short-term and intermediate pivot trends are up, with the current 0.70335 area acting as nearby pivot resistance. The broader structure remains constructive through rising benchmark trends and positive weekly, monthly, and yearly Fib-grid bias, although the 100-day average near 0.7045 is an immediate overhead technical reference. Volume is below its stated VOLMA level, while ATR near 110 reflects a market that remains active following the sharp recovery.
Chart Analysis ATS AI Generated: 2026-10-26 07:00 for Informational use only, not trading advice. Terms and Risk Disclosure Copyright © 2026. Algo Trading Systems LLC.