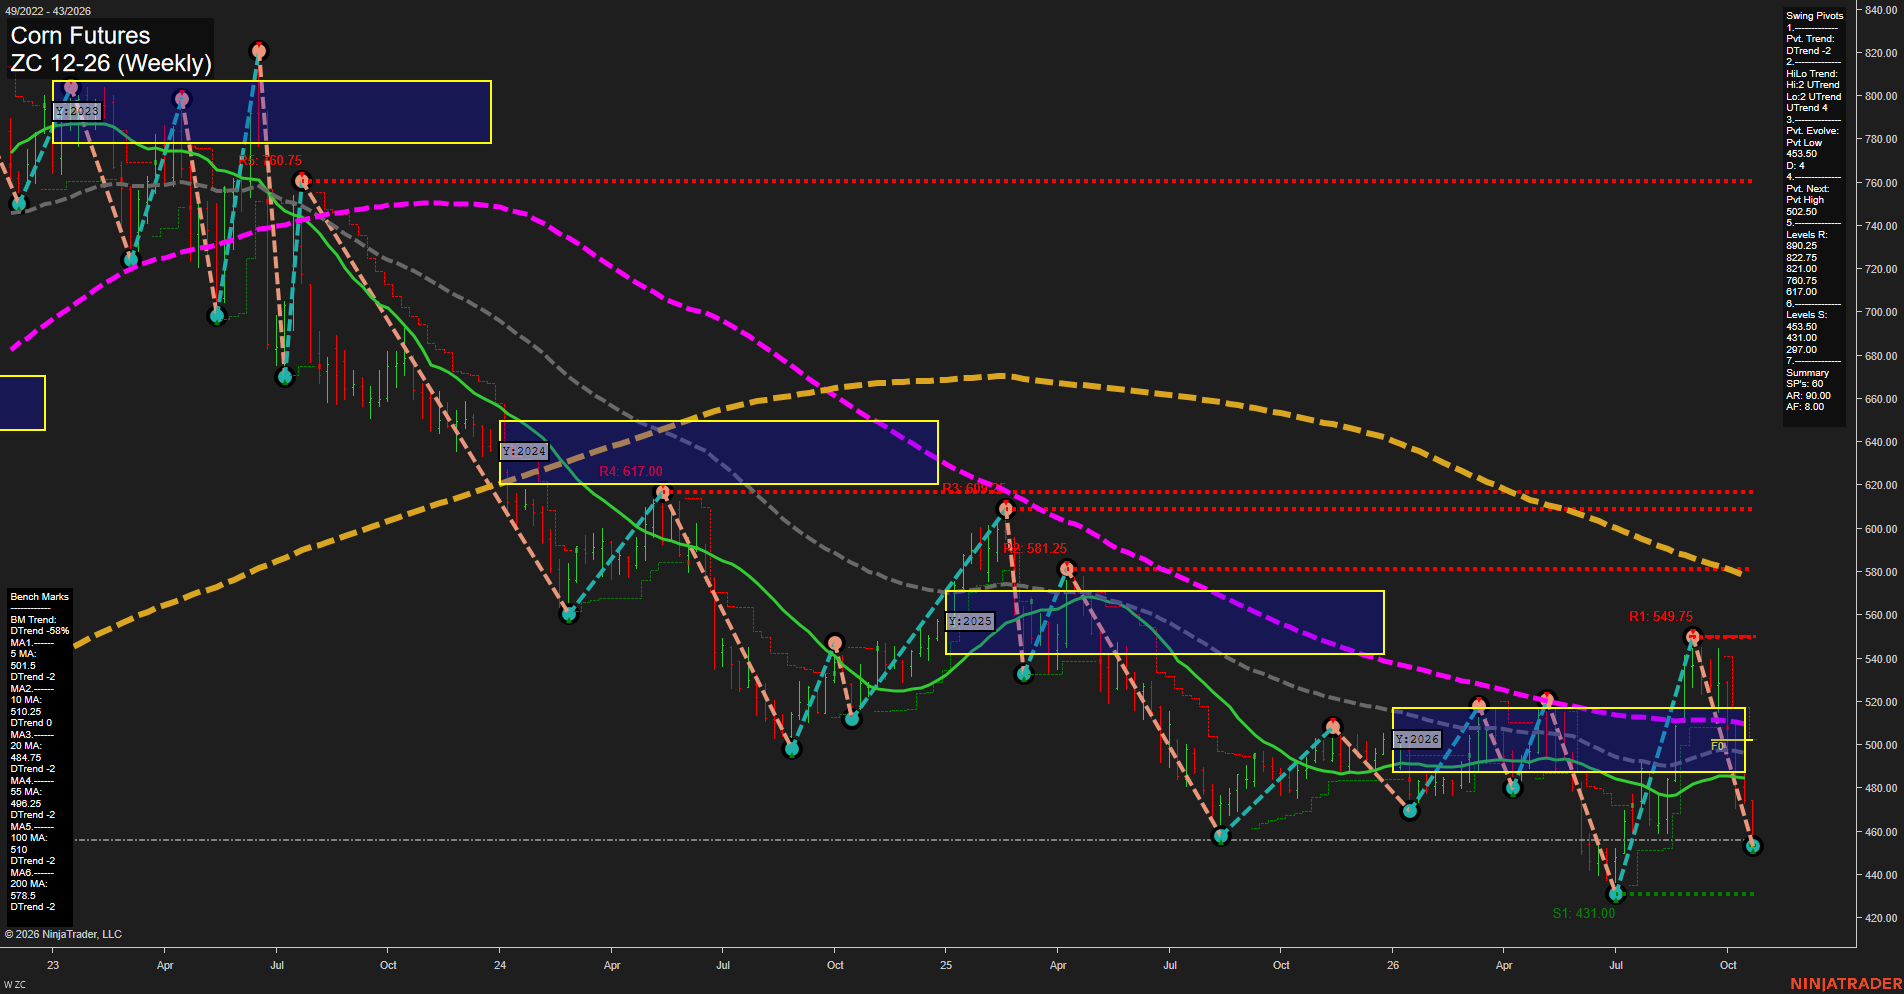
ZC Corn Futures Weekly Chart Analysis: 2026-Oct-25 18:10 CT
Price Action
- Last: 453.50,
- Bars: Medium,
- Mom: Fast.
WSFG Weekly
- Short-Term
- WSFG Current: -66%
- F0%/NTZ' Bias: Price Below,
- WSFG Trend: Down.
MSFG Month Oct
- Intermediate-Term
- MSFG Current: -82%
- F0%/NTZ' Bias: Price Below,
- MSFG Trend: Down.
YSFG Year 2026
- Long-Term
- YSFG Current: -31%
- F0%/NTZ' Bias: Price Below,
- YSFG Trend: Down.
Swing Pivots
- (Short-Term) 1. Pvt. Trend: DTrend,
- (Intermediate-Term) 2. HiLo Trend: UTrend,
- 3. Pvt. Evolve: Pvt low 453.50,
- 4. Pvt. Next: Pvt high 502.50,
- 5. Levels R: 890.25, 822.75, 821.00, 760.75, 617.00,
- 6. Levels S: 453.50, 431.00, 297.00.
Weekly Benchmarks
- (Short-Term) 5 Day: 501.50 Down Trend,
- (Short-Term) 10 Day: 510.25 Down Trend,
- (Intermediate-Term) 20 Day: 484.75 Down Trend,
- (Intermediate-Term) 55 Day: 496.25 Down Trend,
- (Long-Term) 100 Day: 510.00 Down Trend,
- (Long-Term) 200 Day: 578.50 Down Trend.
Recent Trade Signals
- 19 Oct 2026: Short ZC 12-26 @ 467.5 Signals.USAR-WSFG
Overall Rating
- Short-Term: Bearish,
- Intermediate-Term: Bearish,
- Long-Term: Bearish.
Key Insights Summary
Price is in a broad bearish structure, trading beneath every listed weekly benchmark and below the yearly F0%/NTZ area. The recent rebound into the 549.75 pivot-high area was rejected, followed by a sharp decline that returned price to the 453.50 pivot low. Short-term pivot structure remains down, while the intermediate HiLo structure retains an earlier UTrend classification but is under pressure from lower price action, declining benchmarks, and negative weekly and monthly Fib-grid readings. The 502.50 pivot-next level defines the nearest upside structural reference, while 453.50 and 431.00 mark the immediate lower swing references.
Chart Analysis ATS AI Generated: 2026-10-25 18:10 for Informational use only, not trading advice. Terms and Risk Disclosure Copyright © 2026. Algo Trading Systems LLC.