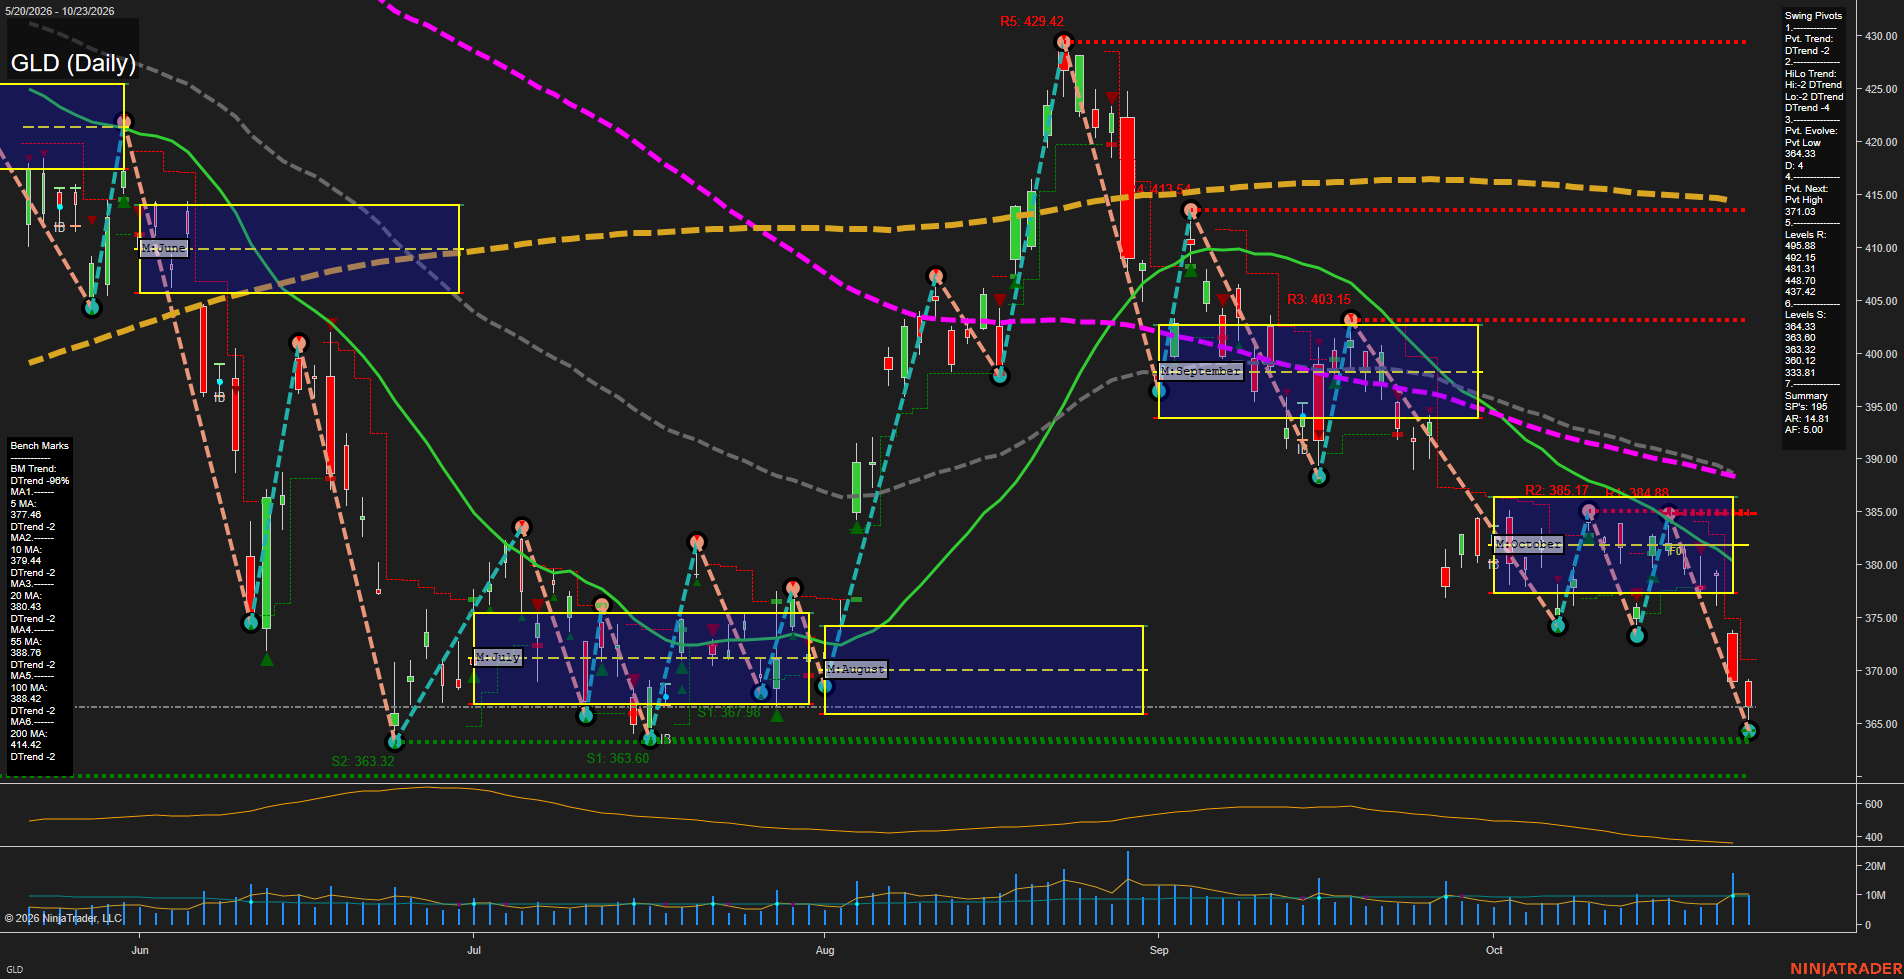
GLD SPDR Gold Shares Daily Chart Analysis: 2026-Oct-25 18:04 CT
Price Action
- Last: 364.33,
- Bars: Large,
- Mom: Fast.
WSFG Weekly
- Short-Term
- WSFG Current: NA%
- F0%/NTZ' Bias: Price Neutral,
- WSFG Trend: Neutral.
MSFG Month Oct
- Intermediate-Term
- MSFG Current: Below NTZ%
- F0%/NTZ' Bias: Price Bearish,
- MSFG Trend: Bearish.
YSFG Year 2026
- Long-Term
- YSFG Current: NA%
- F0%/NTZ' Bias: Price Neutral,
- YSFG Trend: Neutral.
Swing Pivots
- (Short-Term) 1. Pvt. Trend: DTrend,
- (Intermediate-Term) 2. HiLo Trend: DTrend,
- 3. Pvt. Evolve: Pvt low 364.33,
- 4. Pvt. Next: Pvt high 371.03,
- 5. Levels R: 495.38, 492.15, 481.31, 448.70, 437.42,
- 6. Levels S: 364.33, 363.60, 363.32, 360.12, 338.81.
Daily Benchmarks
- (Short-Term) 5 Day: 377.48 Down Trend,
- (Short-Term) 10 Day: 379.44 Down Trend,
- (Intermediate-Term) 20 Day: 380.43 Down Trend,
- (Intermediate-Term) 55 Day: 388.78 Down Trend,
- (Long-Term) 100 Day: 388.42 Down Trend,
- (Long-Term) 200 Day: 414.42 Down Trend.
Additional Metrics
- ATR: 14.81,
- VOLMA: 7207880.
Overall Rating
- Short-Term: Bearish,
- Intermediate-Term: Bearish,
- Long-Term: Bearish.
Key Insights Summary
GLD reflects a futures-style downside impulse: price has broken beneath the October monthly NTZ and F0% area, established a fresh pivot low near 364.33, and remains below every tracked benchmark average. The short-term pivot sequence is lower highs and lower lows, while the intermediate HiLo structure also remains in DTrend. The 363.60 to 360.12 support cluster is the immediate downside reference zone; 371.03 is the next pivot-reversal threshold, with the 5-day and 10-day averages near 377.48 and 379.44 defining the first overhead mean-reversion area. Elevated range expansion and a fast downside momentum profile characterize the current decline.
Chart Analysis ATS AI Generated: 2026-10-25 18:04 for Informational use only, not trading advice. Terms and Risk Disclosure Copyright © 2026. Algo Trading Systems LLC.