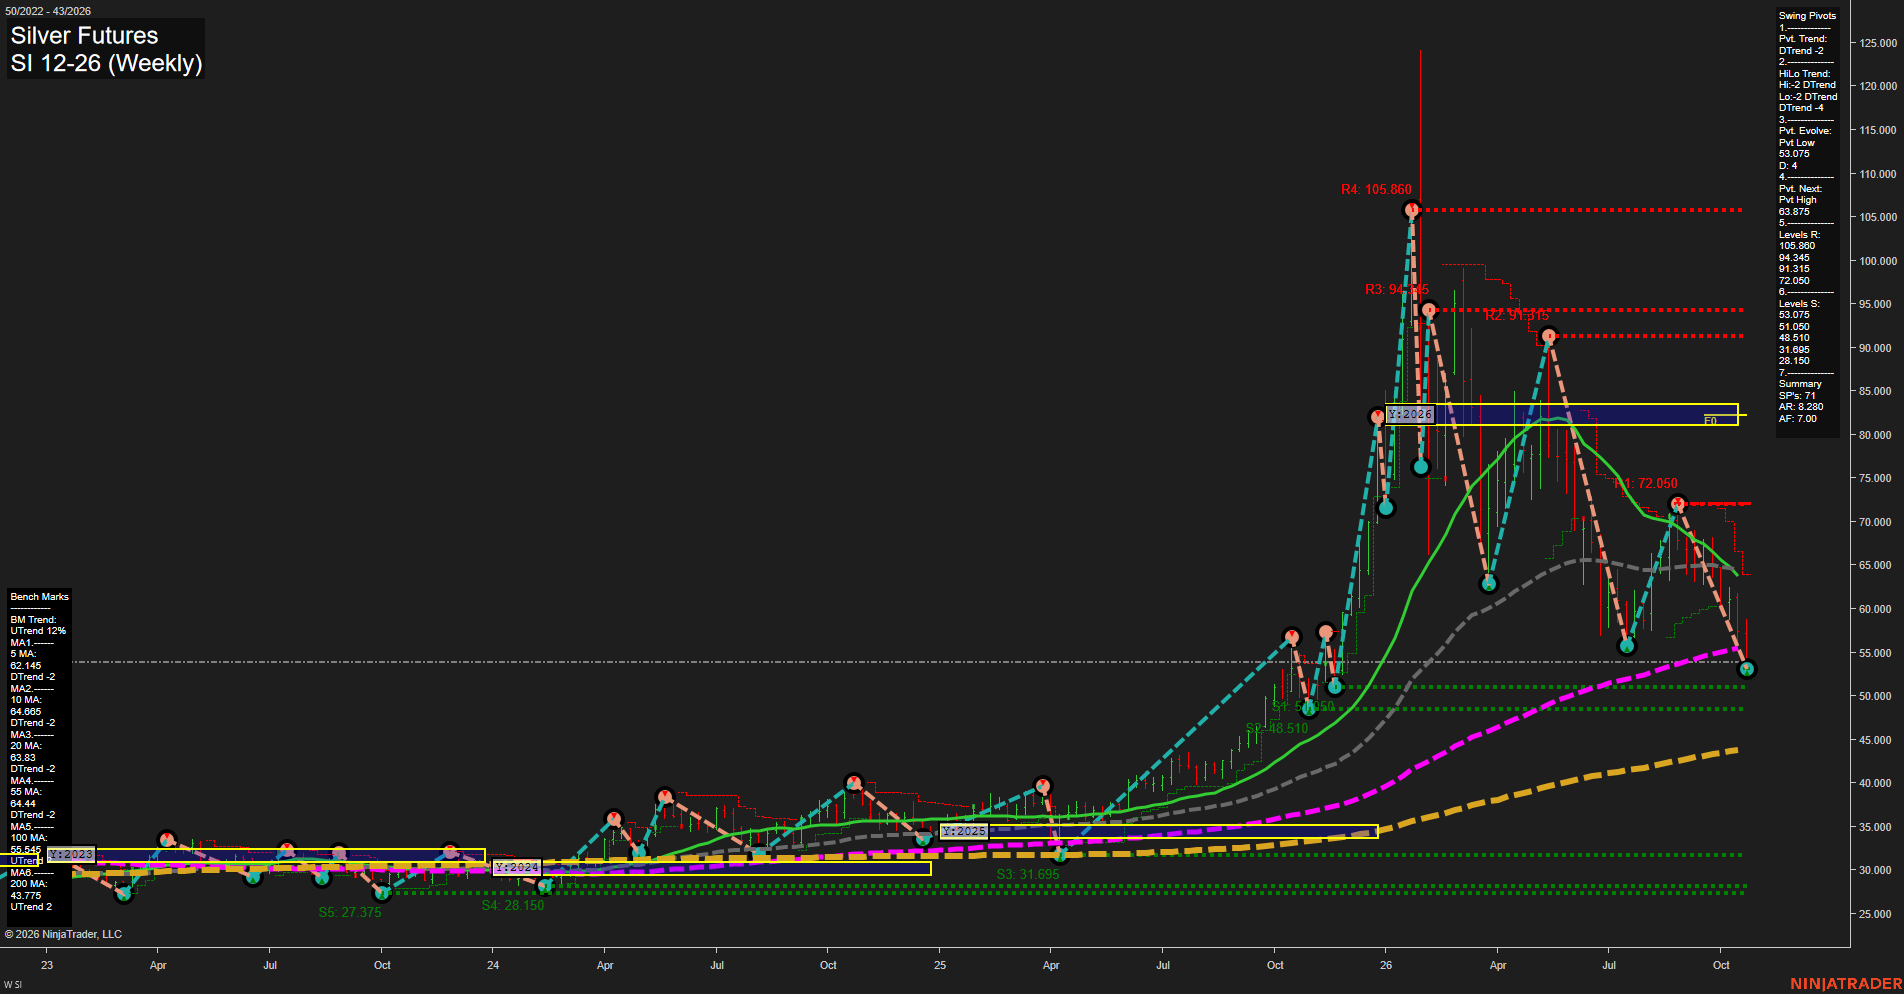
SI Silver Futures Weekly Chart Analysis: 2026-Oct-24 07:07 CT
Price Action
- Last: 53.020,
- Bars: Large,
- Mom: fast.
WSFG Weekly
- Short-Term
- WSFG Current: -66%
- F0%/NTZ' Bias: Price Below,
- WSFG Trend: Down.
MSFG Month Oct
- Intermediate-Term
- MSFG Current: -80%
- F0%/NTZ' Bias: Price Below,
- MSFG Trend: Down.
YSFG Year 2026
- Long-Term
- YSFG Current: -234%
- F0%/NTZ' Bias: Price Below,
- YSFG Trend: Down.
Swing Pivots
- (Short-Term) 1. Pvt. Trend: DTrend,
- (Intermediate-Term) 2. HiLo Trend: DTrend,
- 3. Pvt. Evolve: Pvt low 53.075,
- 4. Pvt. Next: Pvt high 63.875,
- 5. Levels R: 105.860, 94.345, 91.315, 72.050,
- 6. Levels S: 53.050, 48.510, 31.695, 28.150, 27.375.
Weekly Benchmarks
- (Short-Term) 5 Day: 62.145 Down Trend,
- (Short-Term) 10 Day: 64.665 Down Trend,
- (Intermediate-Term) 20 Day: 63.830 Down Trend,
- (Intermediate-Term) 55 Day: 64.440 Down Trend,
- (Long-Term) 100 Day: 55.545 Up Trend,
- (Long-Term) 200 Day: 43.775 Up Trend.
Recent Trade Signals
- 22 Oct 2026: Short SI 12-26 @ 56.35 Signals.USAR.TR120
- 22 Oct 2026: Short SI 12-26 @ 56.41 Signals.USAR-WSFG
Overall Rating
- Short-Term: Bearish,
- Intermediate-Term: Bearish,
- Long-Term: Bearish.
Key Insights Summary
Silver futures remain in a high-volatility corrective selloff following the prior spike toward 105.860. Large weekly bars, fast downside momentum, a DTrend pivot structure, and price beneath the declining 5-, 10-, 20-, and 55-week benchmarks define the near- and intermediate-term bearish sequence. Price is testing the 53.050 pivot-support area, with 48.510 the next lower structural support. The 63.875 pivot-next level and the clustered 63.830-64.665 benchmark zone define the nearest countertrend recovery area. Despite rising 100- and 200-week averages, the yearly grid remains deeply below its F0%/NTZ reference, leaving the longer-cycle structure in a retracement phase.
Chart Analysis ATS AI Generated: 2026-10-24 07:07 for Informational use only, not trading advice. Terms and Risk Disclosure Copyright © 2026. Algo Trading Systems LLC.