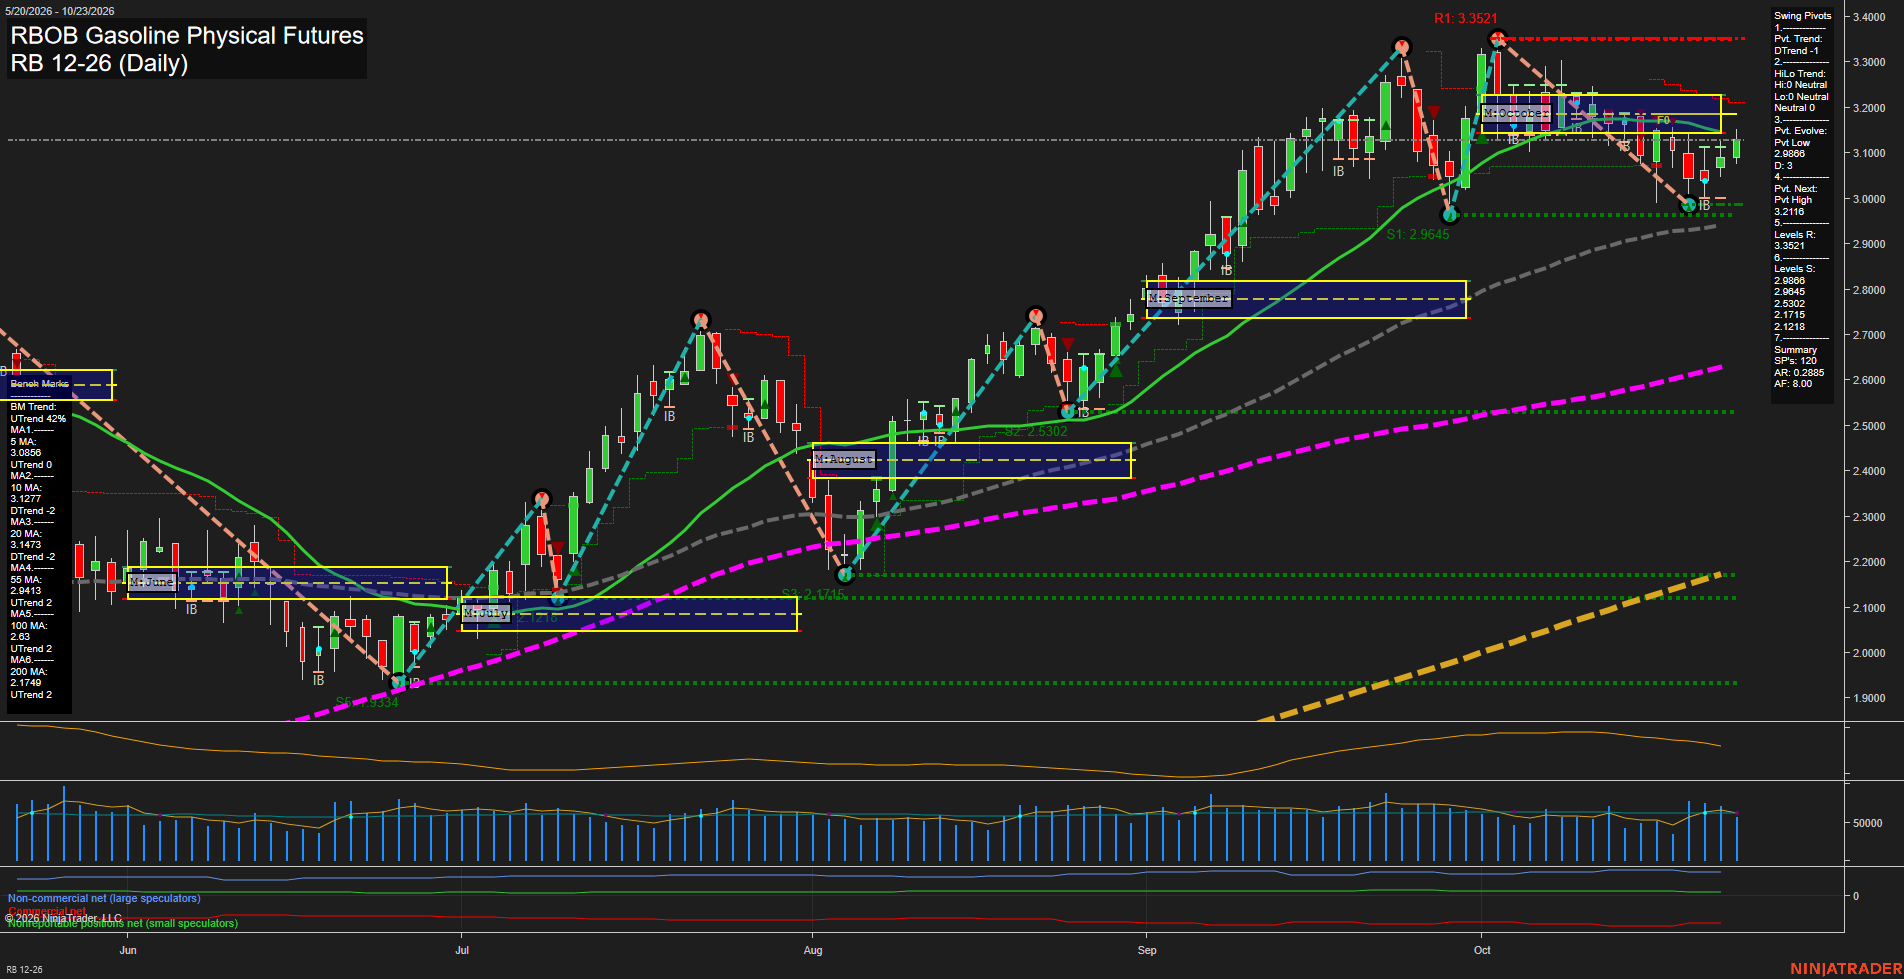
RB RBOB Gasoline Physical Futures Daily Chart Analysis: 2026-Oct-24 07:06 CT
Price Action
- Last: 3.1216,
- Bars: Medium,
- Mom: Average.
WSFG Weekly
- Short-Term
- WSFG Current: 1%
- F0%/NTZ' Bias: Price Above,
- WSFG Trend: Up.
MSFG Month Oct
- Intermediate-Term
- MSFG Current: -5%
- F0%/NTZ' Bias: Price Below,
- MSFG Trend: Down.
YSFG Year 2026
- Long-Term
- YSFG Current: 233%
- F0%/NTZ' Bias: Price Above,
- YSFG Trend: Up.
Swing Pivots
- (Short-Term) 1. Pvt. Trend: DTrend,
- (Intermediate-Term) 2. HiLo Trend: UTrend,
- 3. Pvt. Evolve: Pvt low 2.9868,
- 4. Pvt. Next: Pvt high 3.2116,
- 5. Levels R: 3.3521,
- 6. Levels S: 2.9868, 2.9645, 2.5302, 2.1715, 2.1218.
Daily Benchmarks
- (Short-Term) 5 Day: 3.0856 Up Trend,
- (Short-Term) 10 Day: 3.1277 Down Trend,
- (Intermediate-Term) 20 Day: 3.1473 Down Trend,
- (Intermediate-Term) 55 Day: 2.9413 Up Trend,
- (Long-Term) 100 Day: 2.6380 Up Trend,
- (Long-Term) 200 Day: 2.1749 Up Trend.
Additional Metrics
Recent Trade Signals
- 23 Oct 2026: Long RB 12-26 @ 3.1192 Signals.USAR.TR120
- 22 Oct 2026: Short RB 12-26 @ 3.0865 Signals.USAR-WSFG
- 22 Oct 2026: Short RB 12-26 @ 3.0942 Signals.USAR-MSFG
- 20 Oct 2026: Short RB 12-26 @ 3.0202 Signals.USAR.TR720
Overall Rating
- Short-Term: Bearish,
- Intermediate-Term: Neutral,
- Long-Term: Bullish.
Key Insights Summary
Price is rebounding from the 2.9868 pivot-low area but remains beneath the 10-day and 20-day benchmarks and below the October MSFG F0% region. The short-term pivot structure remains in DTrend, defining the recent action as a countertrend bounce within a broader October consolidation. Intermediate structure is mixed: the 55-day average remains rising while the monthly grid and 20-day average reflect a corrective phase. The longer-term trend remains constructive, with price materially above rising 100-day and 200-day benchmarks and the yearly grid maintaining an upward bias. Resistance is concentrated near 3.2116 and 3.3521, while 2.9868 and 2.9645 remain the nearest support cluster.
Chart Analysis ATS AI Generated: 2026-10-24 07:06 for Informational use only, not trading advice. Terms and Risk Disclosure Copyright © 2026. Algo Trading Systems LLC.