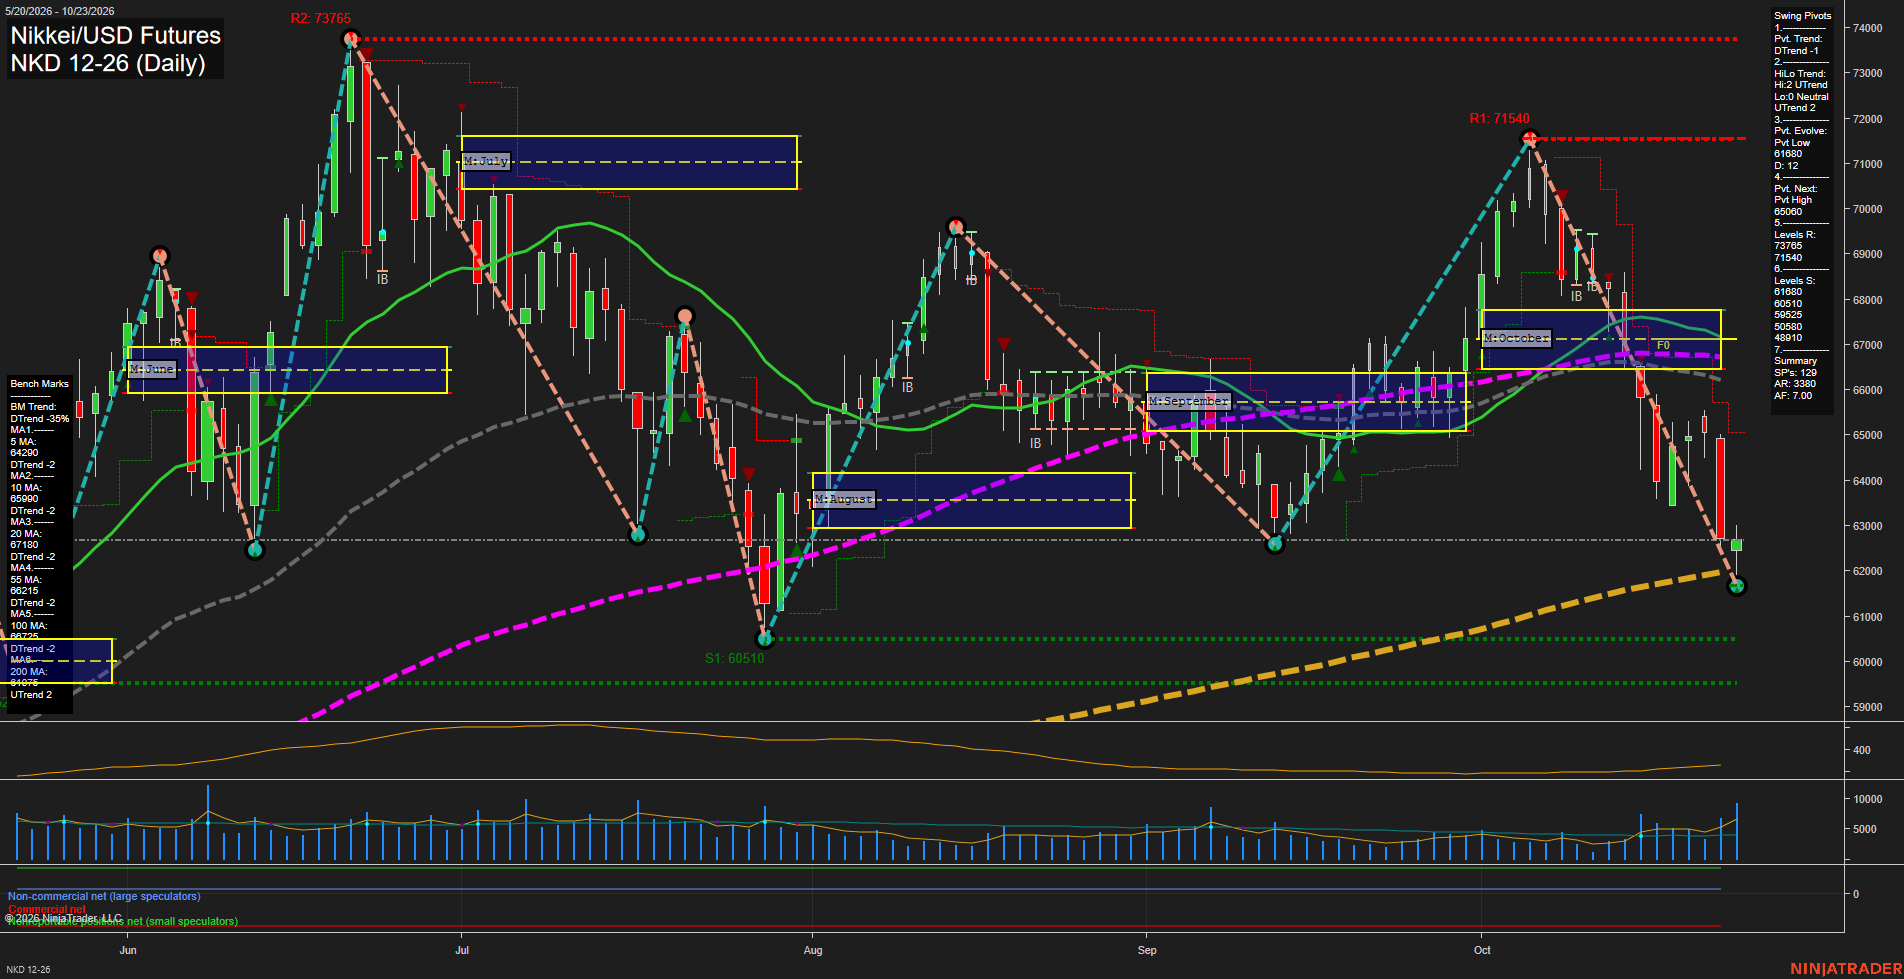
NKD Nikkei/USD Futures Daily Chart Analysis: 2026-Oct-24 07:05 CT
Price Action
- Last: 62315,
- Bars: Medium,
- Mom: fast.
WSFG Weekly
- Short-Term
- WSFG Current: -16%
- F0%/NTZ' Bias: Price Below,
- WSFG Trend: Down.
MSFG Month Oct
- Intermediate-Term
- MSFG Current: -83%
- F0%/NTZ' Bias: Price Below,
- MSFG Trend: Down.
YSFG Year 2026
- Long-Term
- YSFG Current: 144%
- F0%/NTZ' Bias: Price Above,
- YSFG Trend: Up.
Swing Pivots
- (Short-Term) 1. Pvt. Trend: DTrend,
- (Intermediate-Term) 2. HiLo Trend: UTrend,
- 3. Pvt. Evolve: Pvt low 61680,
- 4. Pvt. Next: Pvt high 65060,
- 5. Levels R: 73765, 71540,
- 6. Levels S: 61680, 60510, 59525, 50580, 48190.
Daily Benchmarks
- (Short-Term) 5 Day: 64290 Down Trend,
- (Short-Term) 10 Day: 65990 Down Trend,
- (Intermediate-Term) 20 Day: 67180 Down Trend,
- (Intermediate-Term) 55 Day: 66215 Down Trend,
- (Long-Term) 100 Day: 68745 Down Trend,
- (Long-Term) 200 Day: 61950 Up Trend.
Additional Metrics
Recent Trade Signals
- 23 Oct 2026: Short NKD 12-26 @ 62635 Signals.USAR-WSFG
- 22 Oct 2026: Short NKD 12-26 @ 63630 Signals.USAR.TR120
Overall Rating
- Short-Term: Bearish,
- Intermediate-Term: Bearish,
- Long-Term: Bullish.
Key Insights Summary
Price has undergone a fast, high-volatility selloff from the 71540 October pivot high and remains below all short-, intermediate-, and long-term benchmark averages except the rising 200-day average. The short-term pivot sequence is bearish, with lower highs and lower lows, while price trades beneath both the weekly and monthly Fib-grid centers. The 61680 pivot low is the immediate structural reference, with 60510 and 59525 representing deeper support zones. The intermediate pivot structure remains upward because the broader advance from the August low has not been fully invalidated, while the yearly Fib position and rising 200-day average preserve a constructive long-term backdrop. A rebound from the latest low is present, but it remains a countertrend bounce while price is below 65060 and the clustered moving-average resistance zone.
Chart Analysis ATS AI Generated: 2026-10-24 07:05 for Informational use only, not trading advice. Terms and Risk Disclosure Copyright © 2026. Algo Trading Systems LLC.