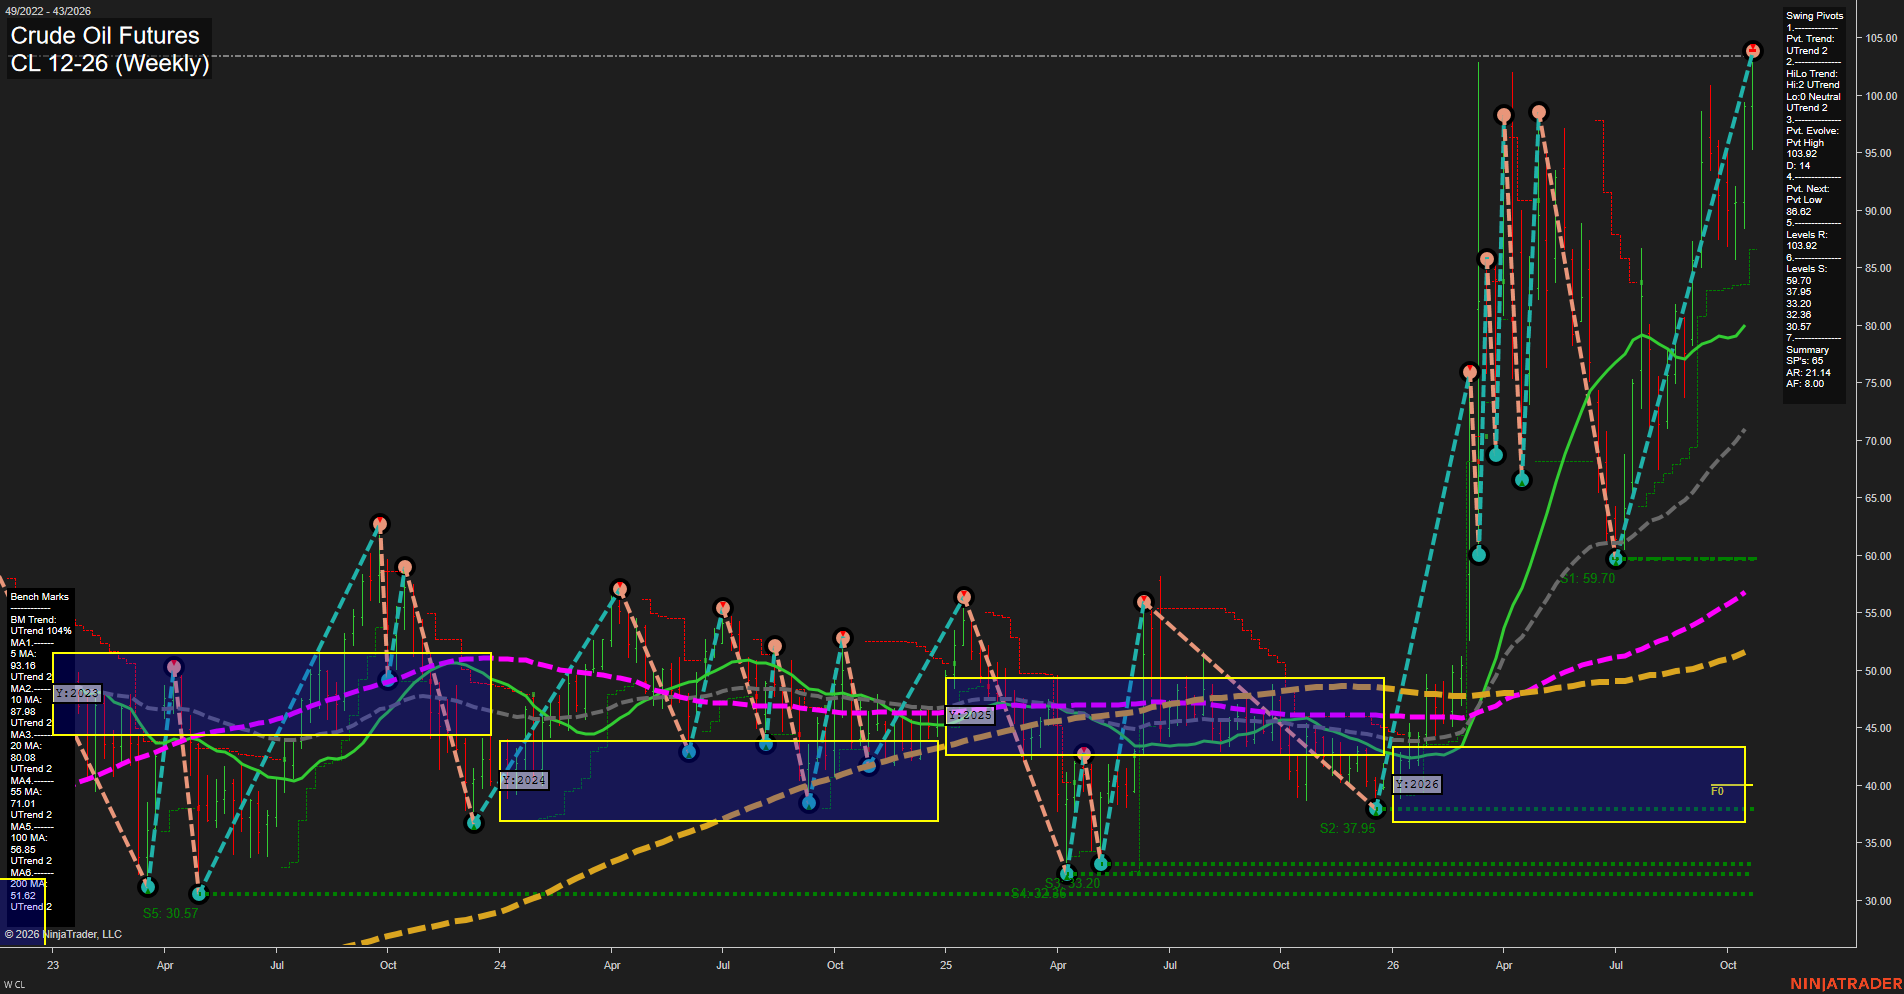
CL Crude Oil Futures Weekly Chart Analysis: 2026-Oct-24 07:02 CT
Price Action
- Last: 105.00,
- Bars: Large,
- Mom: Momentum fast.
WSFG Weekly
- Short-Term
- WSFG Current: 49%
- F0%/NTZ' Bias: Price Above,
- WSFG Trend: Up.
MSFG Month Oct
- Intermediate-Term
- MSFG Current: 92%
- F0%/NTZ' Bias: Price Above,
- MSFG Trend: Up.
YSFG Year 2026
- Long-Term
- YSFG Current: 193%
- F0%/NTZ' Bias: Price Above,
- YSFG Trend: Up.
Swing Pivots
- (Short-Term) 1. Pvt. Trend: UTrend,
- (Intermediate-Term) 2. HiLo Trend: UTrend,
- 3. Pvt. Evolve: Pvt high 103.92,
- 4. Pvt. Next: Pvt low 86.02,
- 5. Levels R: 103.92,
- 6. Levels S: 59.70, 37.95, 33.20, 32.36, 30.57.
Weekly Benchmarks
- (Short-Term) 5 Day: 93.16 Up Trend,
- (Short-Term) 10 Day: 87.98 Up Trend,
- (Intermediate-Term) 20 Day: 80.08 Up Trend,
- (Intermediate-Term) 55 Day: 71.01 Up Trend,
- (Long-Term) 100 Day: 56.85 Up Trend,
- (Long-Term) 200 Day: 51.62 Up Trend.
Recent Trade Signals
- 23 Oct 2026: Long CL 12-26 @ 100.72 Signals.USAR.TR120
- 23 Oct 2026: Long CL 12-26 @ 100.36 Signals.USAR-WSFG
Overall Rating
- Short-Term: Bullish,
- Intermediate-Term: Bullish,
- Long-Term: Bullish.
Key Insights Summary
Price is accelerating into new swing-high territory near 105.00, with large weekly bars, fast momentum, higher pivot structure, and price above every benchmark average. The weekly, monthly, and yearly fib grids are all advancing above their F0%/NTZ references, confirming broad multi-timeframe trend alignment. The 103.92 pivot resistance has been exceeded, while the substantial separation above the 5-, 10-, and 20-week benchmarks reflects a strong but extended advance. The next defined opposite pivot level is 86.02, with deeper structural support concentrated at 59.70 and below.
Chart Analysis ATS AI Generated: 2026-10-24 07:02 for Informational use only, not trading advice. Terms and Risk Disclosure Copyright © 2026. Algo Trading Systems LLC.