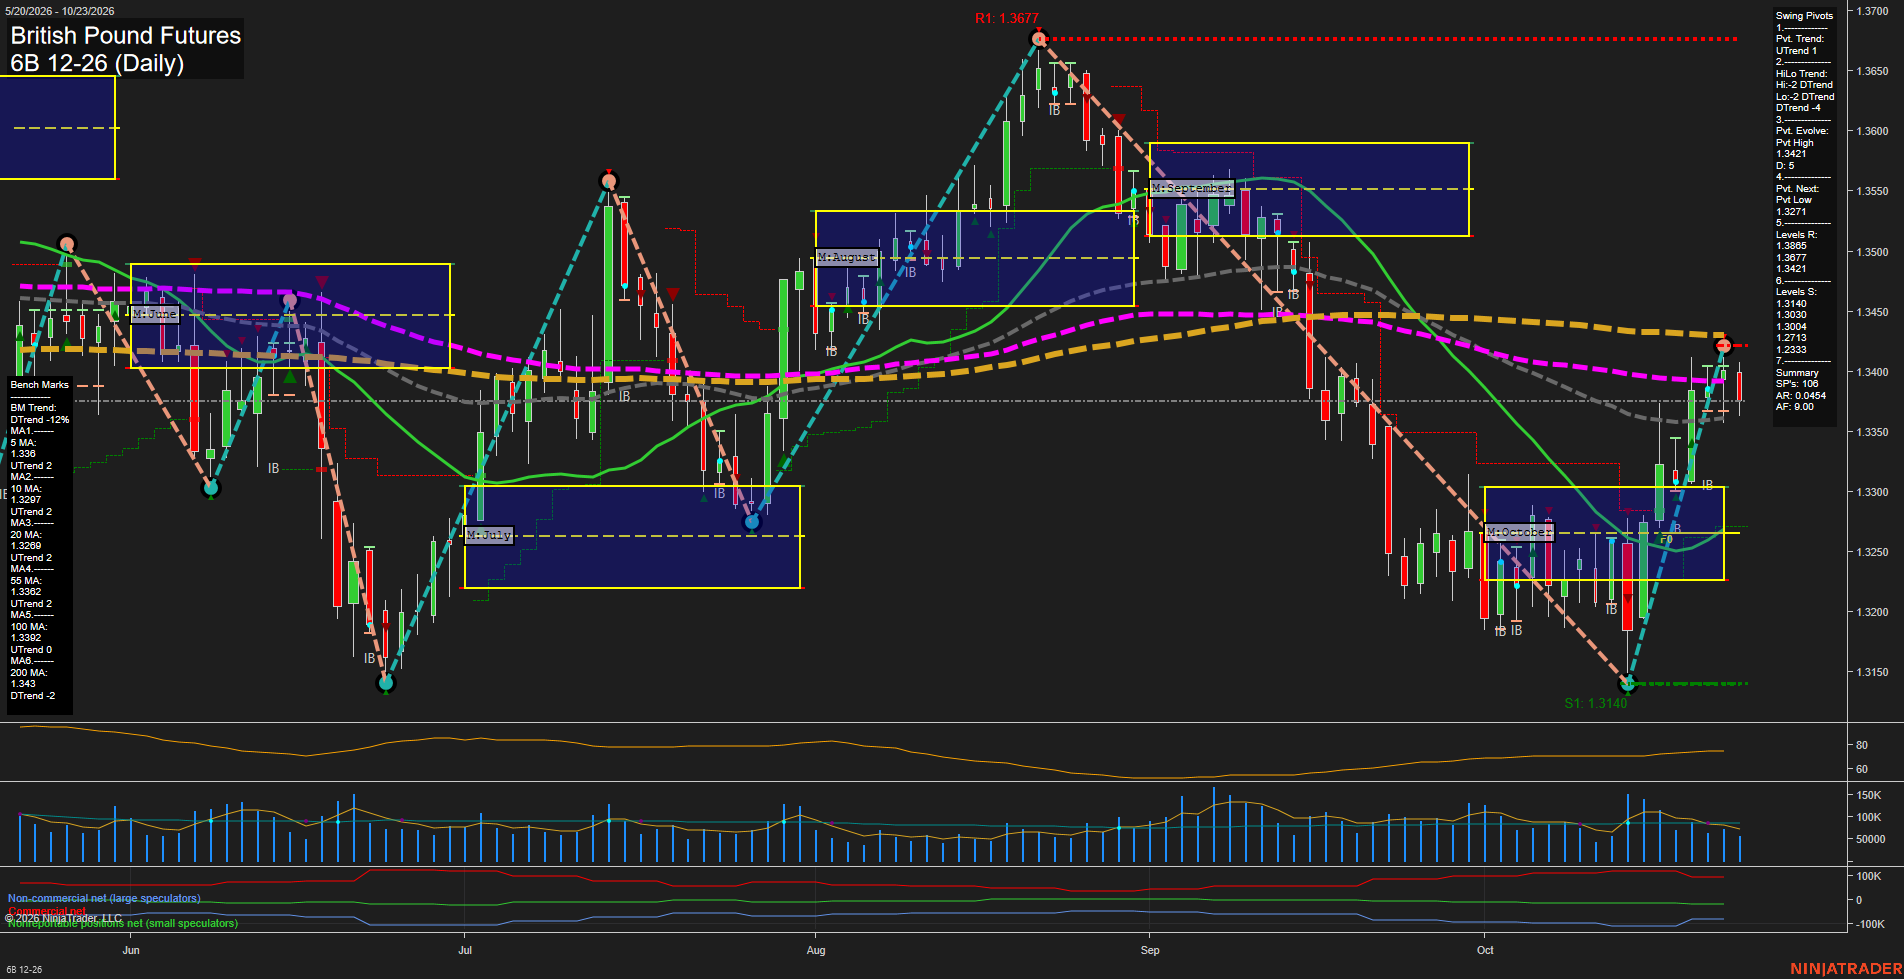
6B British Pound Futures Daily Chart Analysis: 2026-Oct-24 07:00 CT
Price Action
- Last: 1.3386,
- Bars: Medium,
- Mom: fast.
WSFG Weekly
- Short-Term
- WSFG Current: 36%
- F0%/NTZ' Bias: Price Above,
- WSFG Trend: Up.
MSFG Month Oct
- Intermediate-Term
- MSFG Current: 40%
- F0%/NTZ' Bias: Price Above,
- MSFG Trend: Up.
YSFG Year 2026
- Long-Term
- YSFG Current: -7%
- F0%/NTZ' Bias: Price Below,
- YSFG Trend: Down.
Swing Pivots
- (Short-Term) 1. Pvt. Trend: UTrend,
- (Intermediate-Term) 2. HiLo Trend: DTrend,
- 3. Pvt. Evolve: Pvt high 1.3421,
- 4. Pvt. Next: Pvt low 1.3271,
- 5. Levels R: 1.3865, 1.3677, 1.3421,
- 6. Levels S: 1.3140, 1.3004, 1.2713, 1.2333.
Daily Benchmarks
- (Short-Term) 5 Day: 1.3346 Up Trend,
- (Short-Term) 10 Day: 1.3297 Up Trend,
- (Intermediate-Term) 20 Day: 1.3269 Up Trend,
- (Intermediate-Term) 55 Day: 1.3332 Up Trend,
- (Long-Term) 100 Day: 1.3392 Up Trend,
- (Long-Term) 200 Day: 1.3434 Down Trend.
Additional Metrics
Recent Trade Signals
- 20 Oct 2026: Long 6B 12-26 @ 1.3378 Signals.USAR.TR720
- 20 Oct 2026: Long 6B 12-26 @ 1.3352 Signals.USAR-WSFG
- 19 Oct 2026: Long 6B 12-26 @ 1.3327 Signals.USAR-MSFG
Overall Rating
- Short-Term: Bullish,
- Intermediate-Term: Bullish,
- Long-Term: Bearish.
Key Insights Summary
The daily chart shows a sharp V-shaped recovery from the 1.3140 swing low, with price reclaiming the 5-, 10-, 20-, and 55-day benchmarks and the weekly and monthly Fib-grid centers. Short-term momentum is fast and the active pivot trend is up, while 1.3421 is the immediate pivot resistance zone. The intermediate pivot structure remains down, reflecting the prior decline from the 1.3677 high, and the recovery is approaching the 100-day average near 1.3392 and the declining 200-day average near 1.3434. The broader yearly grid remains below its center and down, defining the rally as a recovery within a still-weaker long-term structure.
Chart Analysis ATS AI Generated: 2026-10-24 07:00 for Informational use only, not trading advice. Terms and Risk Disclosure Copyright © 2026. Algo Trading Systems LLC.