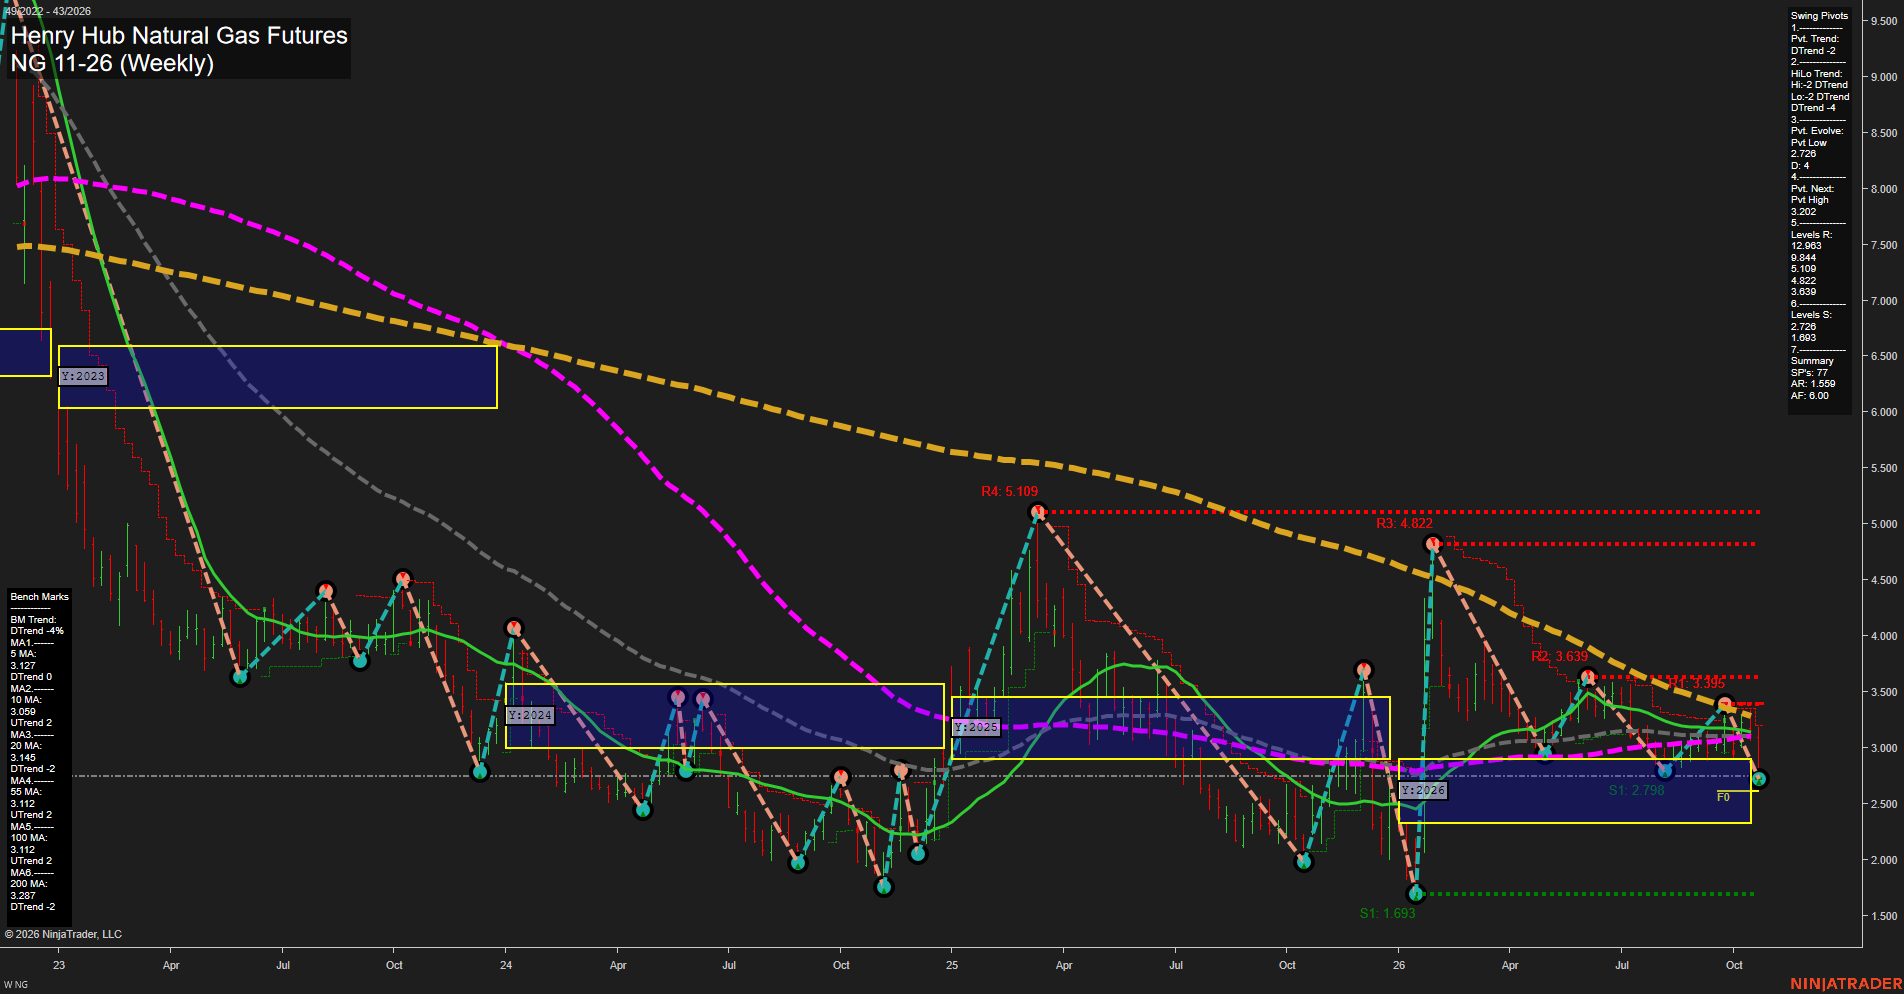
NG Henry Hub Natural Gas Futures Weekly Chart Analysis: 2026-Oct-22 07:06 CT
Price Action
- Last: 2.726,
- Bars: Small,
- Mom: slow.
WSFG Weekly
- Short-Term
- WSFG Current: -78%
- F0%/NTZ' Bias: Price Below,
- WSFG Trend: Down.
MSFG Month Oct
- Intermediate-Term
- MSFG Current: -32%
- F0%/NTZ' Bias: Price Below,
- MSFG Trend: Down.
YSFG Year 2026
- Long-Term
- YSFG Current: 8%
- F0%/NTZ' Bias: Price Above,
- YSFG Trend: Up.
Swing Pivots
- (Short-Term) 1. Pvt. Trend: DTrend,
- (Intermediate-Term) 2. HiLo Trend: DTrend,
- 3. Pvt. Evolve: Pvt low 2.726,
- 4. Pvt. Next: Pvt high 3.202,
- 5. Levels R: 12.963, 9.844, 5.109, 4.822, 3.639, 3.395,
- 6. Levels S: 2.726, 1.693.
Weekly Benchmarks
- (Short-Term) 5 Day: -- Down Trend,
- (Short-Term) 10 Day: 3.059 Up Trend,
- (Intermediate-Term) 20 Day: 3.145 Down Trend,
- (Intermediate-Term) 55 Day: 3.112 Up Trend,
- (Long-Term) 100 Day: 3.112 Down Trend,
- (Long-Term) 200 Day: 3.287 Down Trend.
Overall Rating
- Short-Term: Bearish,
- Intermediate-Term: Bearish,
- Long-Term: Neutral.
Key Insights Summary
Natural gas remains in a short- and intermediate-term corrective structure, with price below the weekly and monthly F0% areas and the pivot sequence retaining DTrend characteristics. The 2.726 pivot-low area is the immediate structural floor, while 3.202 defines the next pivot reversal threshold; overhead congestion begins at 3.395 and extends through 3.639. Small weekly bars and slow momentum reflect consolidation after the prior decline rather than an impulsive recovery. The yearly grid remains modestly positive and above its F0%, creating a longer-cycle contrast against the declining 100- and 200-period benchmarks and the bearish nearer-term pivot structure.
Chart Analysis ATS AI Generated: 2026-10-22 07:06 for Informational use only, not trading advice. Terms and Risk Disclosure Copyright © 2026. Algo Trading Systems LLC.