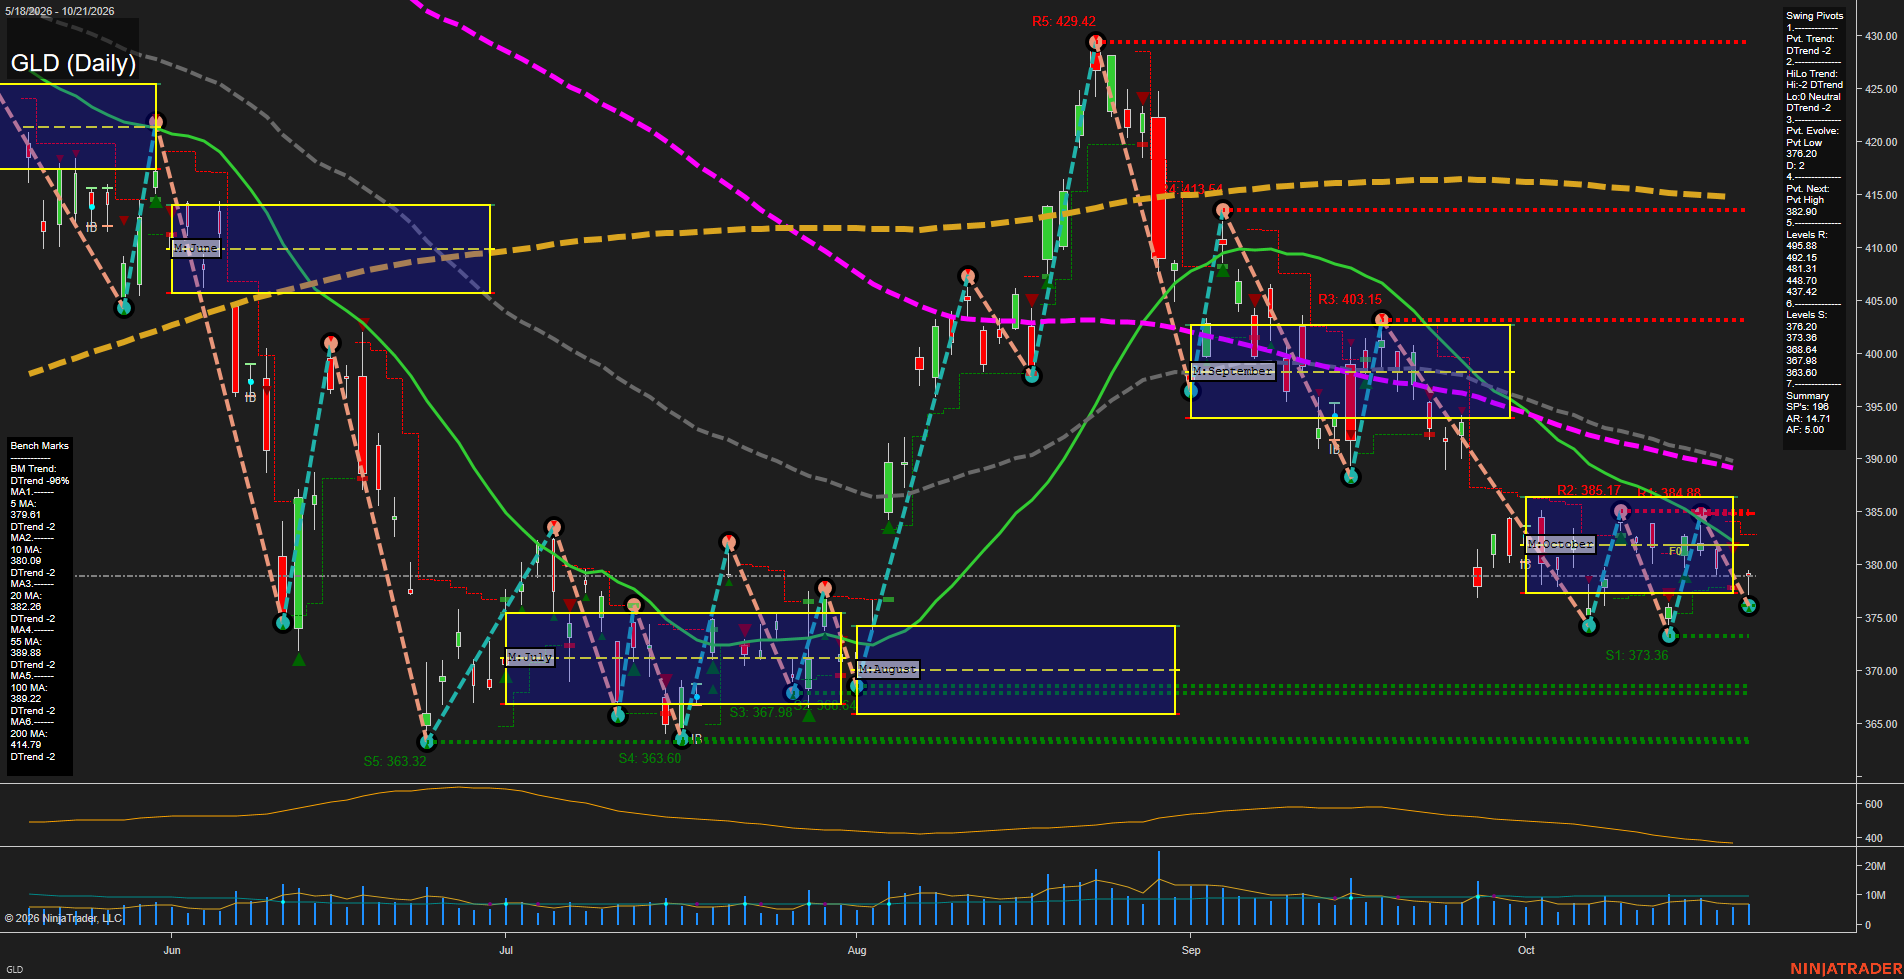
GLD SPDR Gold Shares Daily Chart Analysis: 2026-Oct-22 07:05 CT
Price Action
- Last: 376.20,
- Bars: Small,
- Mom: fast.
WSFG Weekly
- Short-Term
- WSFG Current: NA%
- F0%/NTZ' Bias: Price Neutral,
- WSFG Trend: Neutral.
MSFG Month Oct
- Intermediate-Term
- MSFG Current: NA%
- F0%/NTZ' Bias: Price Bearish,
- MSFG Trend: DTrend.
YSFG Year 2026
- Long-Term
- YSFG Current: NA%
- F0%/NTZ' Bias: Price Neutral,
- YSFG Trend: Neutral.
Swing Pivots
- (Short-Term) 1. Pvt. Trend: DTrend,
- (Intermediate-Term) 2. HiLo Trend: DTrend,
- 3. Pvt. Evolve: Pvt low 376.20,
- 4. Pvt. Next: Pvt high 382.90,
- 5. Levels R: 495.88, 492.15, 481.31, 447.70, 437.42,
- 6. Levels S: 376.20, 373.36, 368.84, 367.98, 363.60.
Daily Benchmarks
- (Short-Term) 5 Day: 379.61 Down Trend,
- (Short-Term) 10 Day: 380.09 Down Trend,
- (Intermediate-Term) 20 Day: 382.26 Down Trend,
- (Intermediate-Term) 55 Day: 389.88 Down Trend,
- (Long-Term) 100 Day: 389.88 Down Trend,
- (Long-Term) 200 Day: 414.79 Down Trend.
Additional Metrics
- ATR: 14.71,
- VOLMA: 5000000.
Overall Rating
- Short-Term: Bearish,
- Intermediate-Term: Bearish,
- Long-Term: Bearish.
Key Insights Summary
GLD remains in a broad futures-style swing decline, with price beneath every benchmark average and the pivot structure showing both short-term and intermediate-term DTrends. The October monthly grid has shifted price into its lower NTZ area, while the recent failed bounce near 384.88 created another lower high. The active 376.20 pivot low is the immediate structural level, followed by supports at 373.36 and the 368.84-363.60 support cluster. A reversal through the 382.90 next-pivot level would be the first indication that the current downside swing is being interrupted; until then, momentum and moving-average alignment remain negative.
Chart Analysis ATS AI Generated: 2026-10-22 07:05 for Informational use only, not trading advice. Terms and Risk Disclosure Copyright © 2026. Algo Trading Systems LLC.