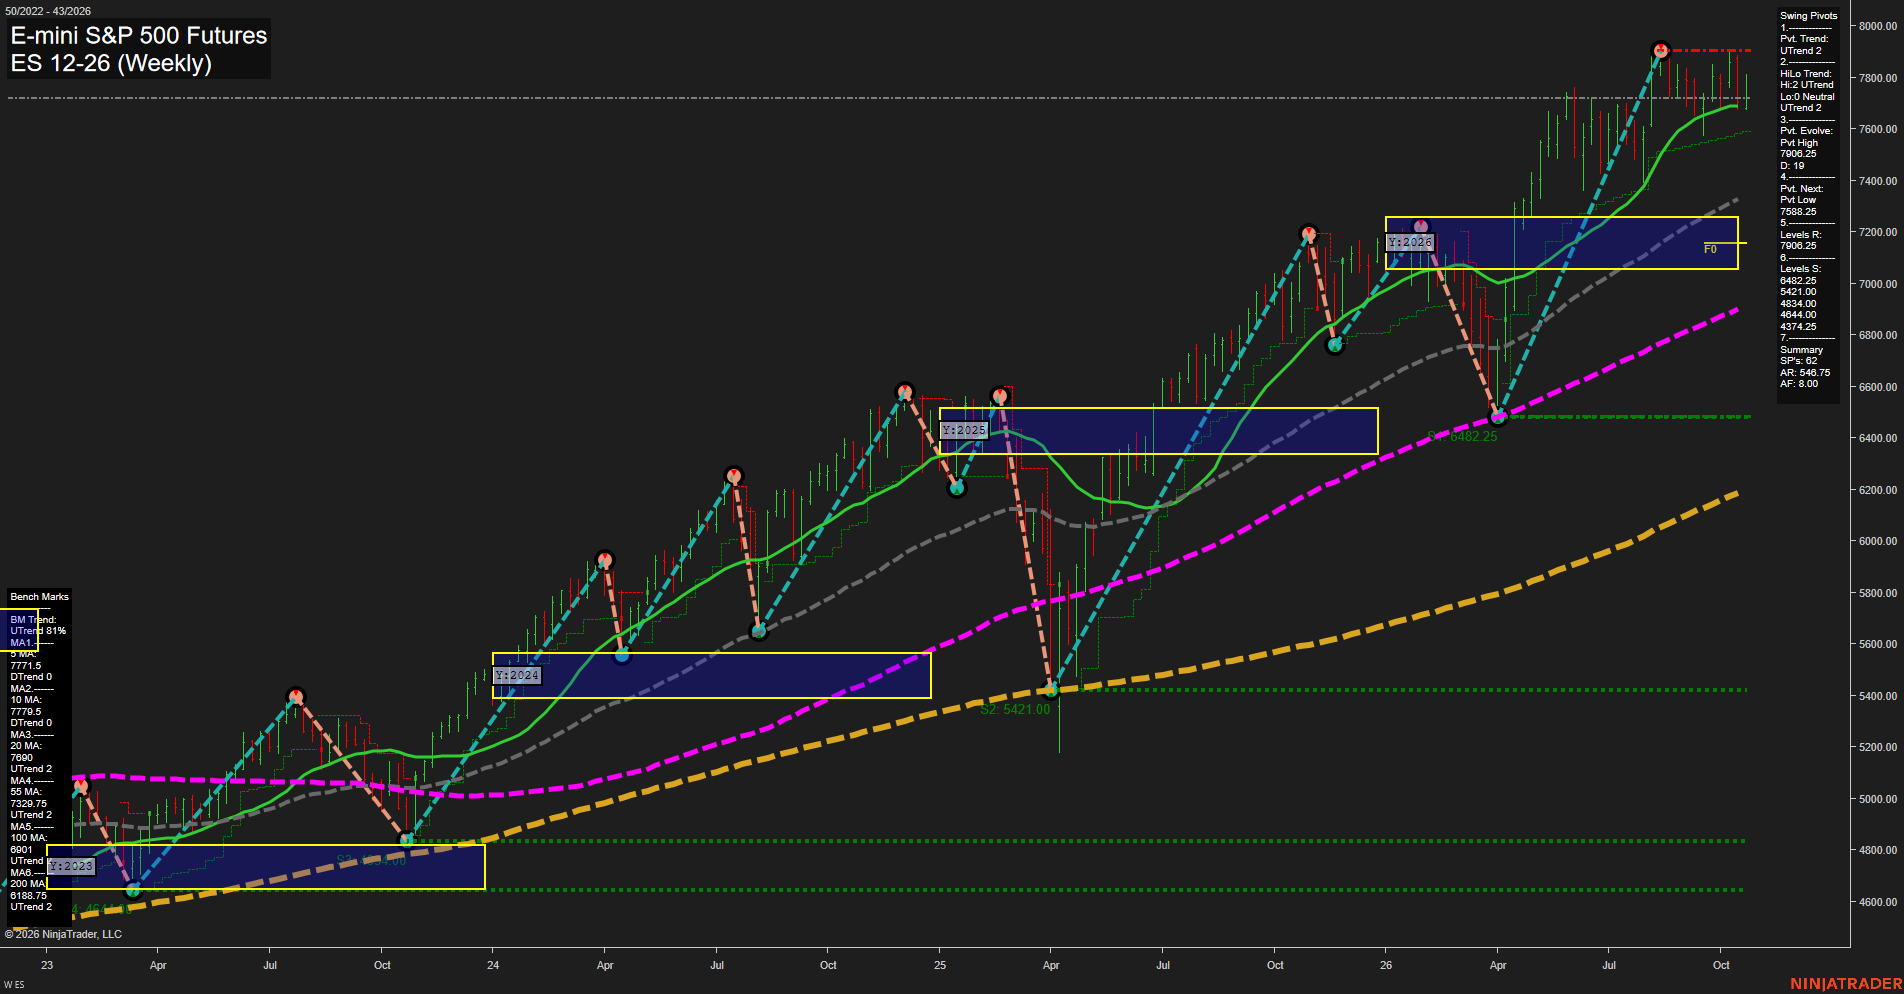
ES E-mini S&P 500 Futures Weekly Chart Analysis: 2026-Oct-22 07:03 CT
Price Action
- Last: 7820.00,
- Bars: Small,
- Mom: Momentum average.
WSFG Weekly
- Short-Term
- WSFG Current: 28%
- F0%/NTZ' Bias: Price Above,
- WSFG Trend: Up.
MSFG Month Oct
- Intermediate-Term
- MSFG Current: -9%
- F0%/NTZ' Bias: Price Below,
- MSFG Trend: Down.
YSFG Year 2026
- Long-Term
- YSFG Current: 55%
- F0%/NTZ' Bias: Price Above,
- YSFG Trend: Up.
Swing Pivots
- (Short-Term) 1. Pvt. Trend: UTrend,
- (Intermediate-Term) 2. HiLo Trend: UTrend,
- 3. Pvt. Evolve: Pvt high 7906.25,
- 4. Pvt. Next: Pvt low 7538.25,
- 5. Levels R: 7960.25,
- 6. Levels S: 6482.25, 5421.00, 4834.00, 4644.00.
Weekly Benchmarks
- (Short-Term) 5 Day: 7771.50 Up Trend,
- (Short-Term) 10 Day: 7779.50 Down Trend,
- (Intermediate-Term) 20 Day: 7690.00 Up Trend,
- (Intermediate-Term) 55 Day: 7329.75 Up Trend,
- (Long-Term) 100 Day: 6901.00 Up Trend,
- (Long-Term) 200 Day: 6188.75 Up Trend.
Recent Trade Signals
- 22 Oct 2026: Short ES 12-26 @ 7720.5 Signals.USAR.TR120
- 22 Oct 2026: Short ES 12-26 @ 7720.5 Signals.USAR-MSFG
Overall Rating
- Short-Term: Bullish,
- Intermediate-Term: Bullish,
- Long-Term: Bullish.
Key Insights Summary
Price remains in a broad weekly uptrend, holding above the rising 20, 55, 100, and 200 period benchmarks while the pivot structure continues to show higher lows and higher highs. The market is consolidating beneath the 7906.25 evolving pivot high and 7960.25 resistance after an extended advance, with small weekly bars reflecting reduced momentum and two short-direction signals highlighting a countertrend phase. The 7538.25 next-pivot level defines the near-term structural reference, while the monthly Fib Grid remains below its F0% level and reflects an intermediate retracement within the stronger yearly uptrend.
Chart Analysis ATS AI Generated: 2026-10-22 07:03 for Informational use only, not trading advice. Terms and Risk Disclosure Copyright © 2026. Algo Trading Systems LLC.