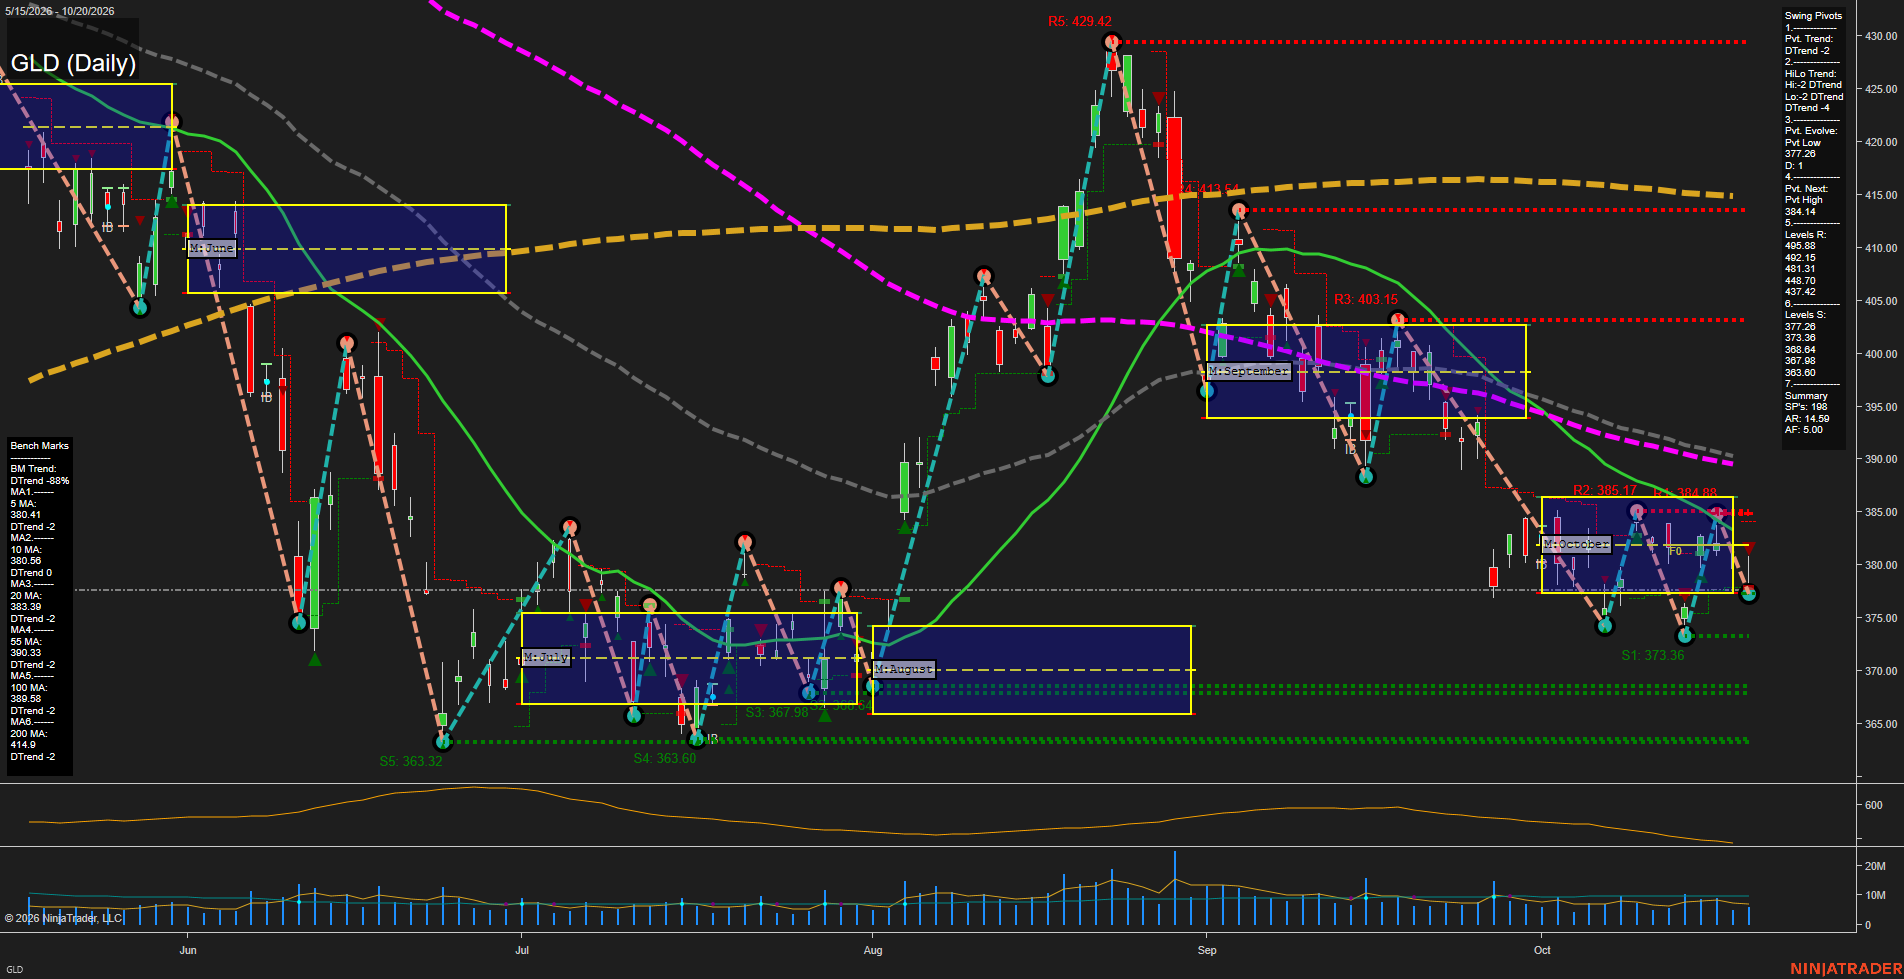
GLD SPDR Gold Shares Daily Chart Analysis: 2026-Oct-21 07:05 CT
Price Action
- Last: 376.59,
- Bars: Large,
- Mom: fast.
WSFG Weekly
- Short-Term
- WSFG Current: NA%
- F0%/NTZ' Bias: Price Neutral,
- WSFG Trend: Neutral.
MSFG Month Oct
- Intermediate-Term
- MSFG Current: -100%
- F0%/NTZ' Bias: Price Bearish,
- MSFG Trend: DTrend.
YSFG Year 2026
- Long-Term
- YSFG Current: NA%
- F0%/NTZ' Bias: Price Neutral,
- YSFG Trend: Neutral.
Swing Pivots
- (Short-Term) 1. Pvt. Trend: DTrend,
- (Intermediate-Term) 2. HiLo Trend: DTrend,
- 3. Pvt. Evolve: Pvt low 372.68,
- 4. Pvt. Next: Pvt high 384.14,
- 5. Levels R: 495.38, 492.15, 481.31, 447.80, 437.42,
- 6. Levels S: 377.26, 373.36, 368.64, 367.98, 363.60.
Daily Benchmarks
- (Short-Term) 5 Day: 380.41 Down Trend,
- (Short-Term) 10 Day: 380.56 Down Trend,
- (Intermediate-Term) 20 Day: 383.90 Down Trend,
- (Intermediate-Term) 55 Day: 390.33 Down Trend,
- (Long-Term) 100 Day: 389.40 Down Trend,
- (Long-Term) 200 Day: 414.90 Down Trend.
Additional Metrics
- ATR: 14.59,
- VOLMA: 7207880.
Overall Rating
- Short-Term: Bearish,
- Intermediate-Term: Bearish,
- Long-Term: Bearish.
Key Insights Summary
GLD reflects a broad bearish futures-style structure: price is below every benchmark average, the short-term pivot trend and intermediate HiLo trend are both in DTrend, and the October MSFG has broken beneath its lower NTZ boundary. The recent rebound toward the 384.14 pivot-high reversal level failed, producing a sharp large-range decline back toward the 373.36 support area. The 377.26 level has shifted into near-term overhead resistance, while 373.36, 368.64, and 363.60 define the lower support sequence. Falling participation versus earlier volume activity and declining ATR from prior elevated levels indicate a continuing directional decline with volatility moderating from the earlier August-September expansion.
Chart Analysis ATS AI Generated: 2026-10-21 07:05 for Informational use only, not trading advice. Terms and Risk Disclosure Copyright © 2026. Algo Trading Systems LLC.