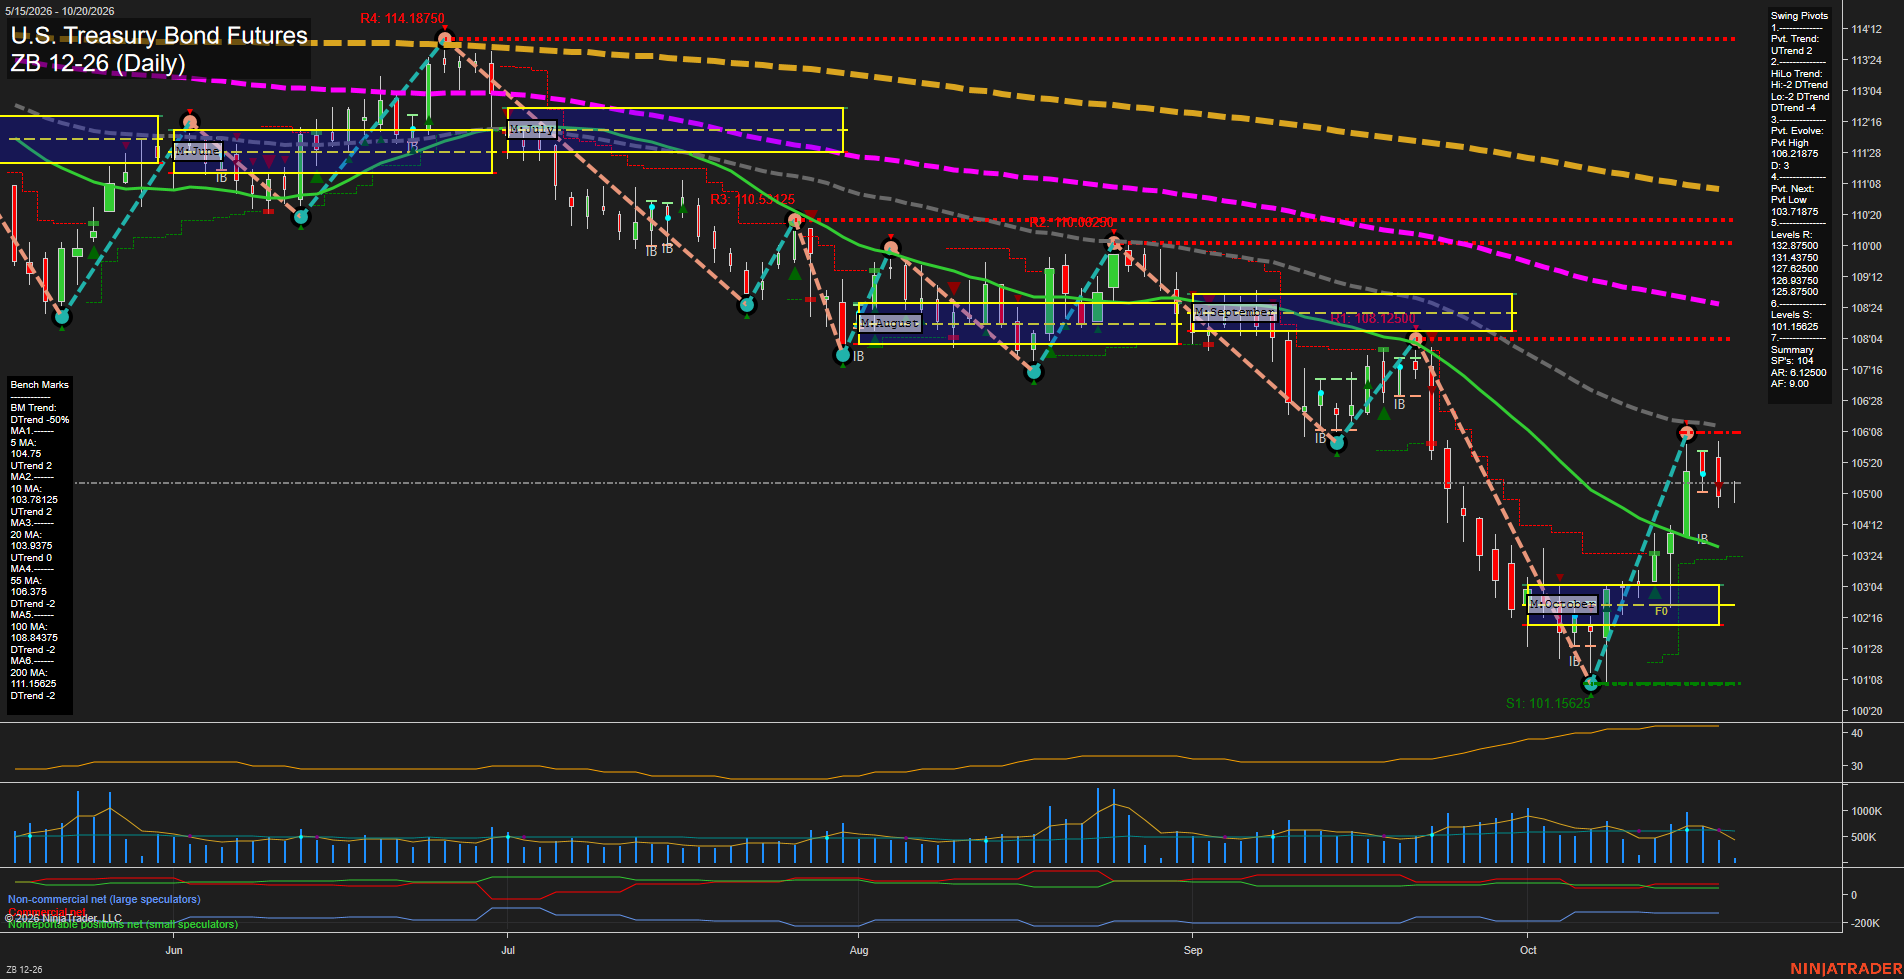
ZB U.S. Treasury Bond Futures Daily Chart Analysis: 2026-Oct-20 07:11 CT
Price Action
- Last: 105'06,
- Bars: Small,
- Mom: Average.
WSFG Weekly
- Short-Term
- WSFG Current: -12%
- F0%/NTZ' Bias: Price Below,
- WSFG Trend: Down.
MSFG Month Oct
- Intermediate-Term
- MSFG Current: 62%
- F0%/NTZ' Bias: Price Above,
- MSFG Trend: Up.
YSFG Year 2026
- Long-Term
- YSFG Current: -42%
- F0%/NTZ' Bias: Price Below,
- YSFG Trend: Down.
Swing Pivots
- (Short-Term) 1. Pvt. Trend: UTrend,
- (Intermediate-Term) 2. HiLo Trend: DTrend,
- 3. Pvt. Evolve: Pvt high 106'23,
- 4. Pvt. Next: Pvt low 103'18.75,
- 5. Levels R: 132.87500, 131.43750, 128.93750, 127.62500, 125.87500,
- 6. Levels S: 101.15625.
Daily Benchmarks
- (Short-Term) 5 Day: 104.75 Up Trend,
- (Short-Term) 10 Day: 103.78125 Up Trend,
- (Intermediate-Term) 20 Day: 103.9375 Up Trend,
- (Intermediate-Term) 55 Day: 106.375 Down Trend,
- (Long-Term) 100 Day: 108.4375 Down Trend,
- (Long-Term) 200 Day: 111.15625 Down Trend.
Additional Metrics
Overall Rating
- Short-Term: Bullish,
- Intermediate-Term: Neutral,
- Long-Term: Bearish.
Key Insights Summary
Price remains in a short-term recovery structure following the October washout near 101'05, supported by an UTrend pivot condition and rising 5, 10, and 20-day benchmarks. The rebound stalled beneath the 55-day benchmark and the 106'23 pivot high, producing a pullback from the recent recovery peak. Weekly fib positioning remains below its F0%/NTZ area, while the monthly grid remains constructive above its F0% level. The intermediate picture is mixed as the monthly trend is up but the HiLo pivot structure remains in a DTrend. Longer-term structure remains bearish, with price below the declining 55, 100, and 200-day benchmarks and the yearly grid below equilibrium. Volume is moderate relative to the recent rebound, while ATR near 35 reflects an active but contained daily swing environment.
Chart Analysis ATS AI Generated: 2026-10-20 07:11 for Informational use only, not trading advice. Terms and Risk Disclosure Copyright © 2026. Algo Trading Systems LLC.