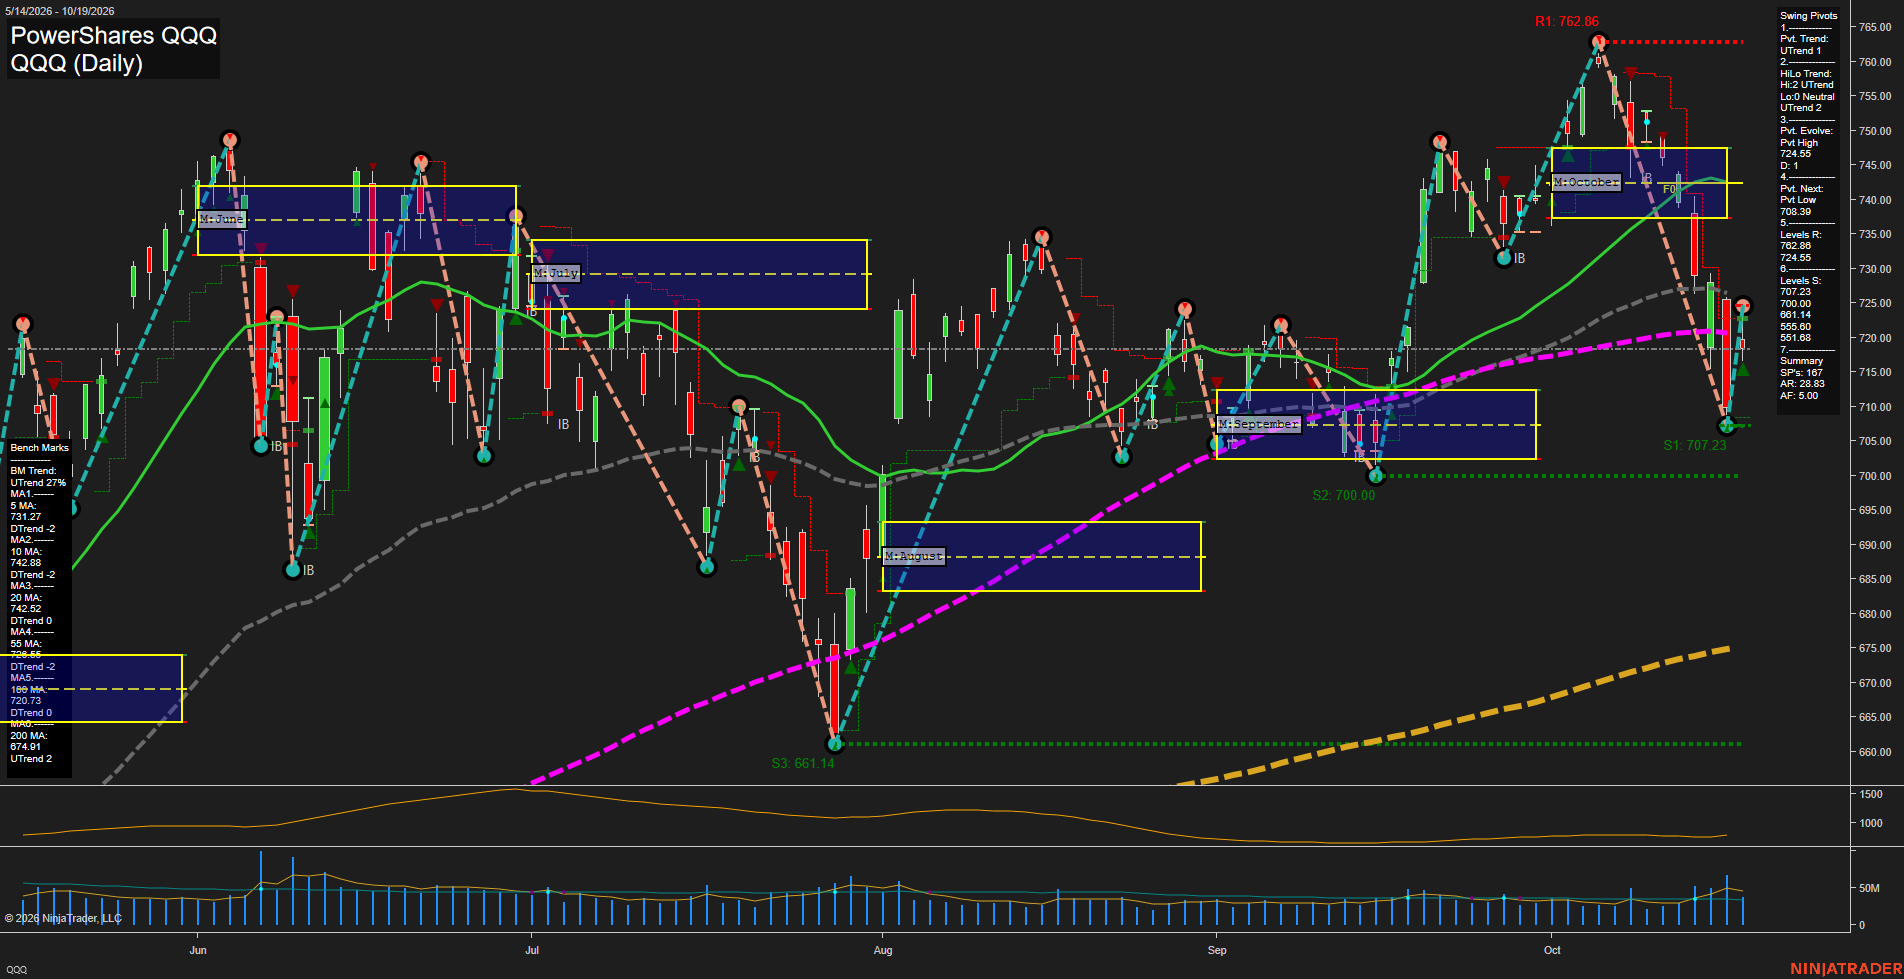
QQQ PowerShares QQQ Daily Chart Analysis: 2026-Oct-20 07:07 CT
Price Action
- Last: 724.55,
- Bars: Medium,
- Mom: fast.
WSFG Weekly
- Short-Term
- WSFG Current: NA%
- F0%/NTZ' Bias: Price Neutral,
- WSFG Trend: Neutral.
MSFG Month Oct
- Intermediate-Term
- MSFG Current: NA%
- F0%/NTZ' Bias: Price Below NTZ Lower,
- MSFG Trend: Bearish.
YSFG Year 2026
- Long-Term
- YSFG Current: NA%
- F0%/NTZ' Bias: Price Neutral,
- YSFG Trend: Neutral.
Swing Pivots
- (Short-Term) 1. Pvt. Trend: UTrend,
- (Intermediate-Term) 2. HiLo Trend: UTrend,
- 3. Pvt. Evolve: Pvt high 724.55,
- 4. Pvt. Next: Pvt low 703.89,
- 5. Levels R: 762.86, 724.55,
- 6. Levels S: 707.23, 700.00, 661.14, 655.60, 551.68.
Daily Benchmarks
- (Short-Term) 5 Day: 731.27 Down Trend,
- (Short-Term) 10 Day: 742.88 Down Trend,
- (Intermediate-Term) 20 Day: 742.52 Down Trend,
- (Intermediate-Term) 55 Day: 726.95 Up Trend,
- (Long-Term) 100 Day: 720.73 Down Trend,
- (Long-Term) 200 Day: 674.91 Up Trend.
Additional Metrics
- ATR: 28.83,
- VOLMA: 32709273.
Overall Rating
- Short-Term: Neutral,
- Intermediate-Term: Neutral,
- Long-Term: Neutral.
Key Insights Summary
QQQ shows a fast rebound from the 707.23 pivot-support area into a developing 724.55 pivot high, restoring the short-term pivot structure to an uptrend. From a futures swing-trader perspective, this resembles a sharp countertrend recovery within a still-mixed benchmark configuration: price remains below the declining 5-, 10-, and 20-day averages, while holding above the 100- and 200-day averages. The October MSFG remains overhead, with price below its lower NTZ boundary, and 724.55 is the immediate pivot resistance level. The 707.23 and 700.00 supports define the recent washout-and-recovery zone; a sustained higher-low structure above that area contrasts with the prior rejection from the 762.86 peak. ATR at 28.83 reflects elevated daily range conditions consistent with active Nasdaq futures-style swings and choppy two-sided price discovery.
Chart Analysis ATS AI Generated: 2026-10-20 07:07 for Informational use only, not trading advice. Terms and Risk Disclosure Copyright © 2026. Algo Trading Systems LLC.