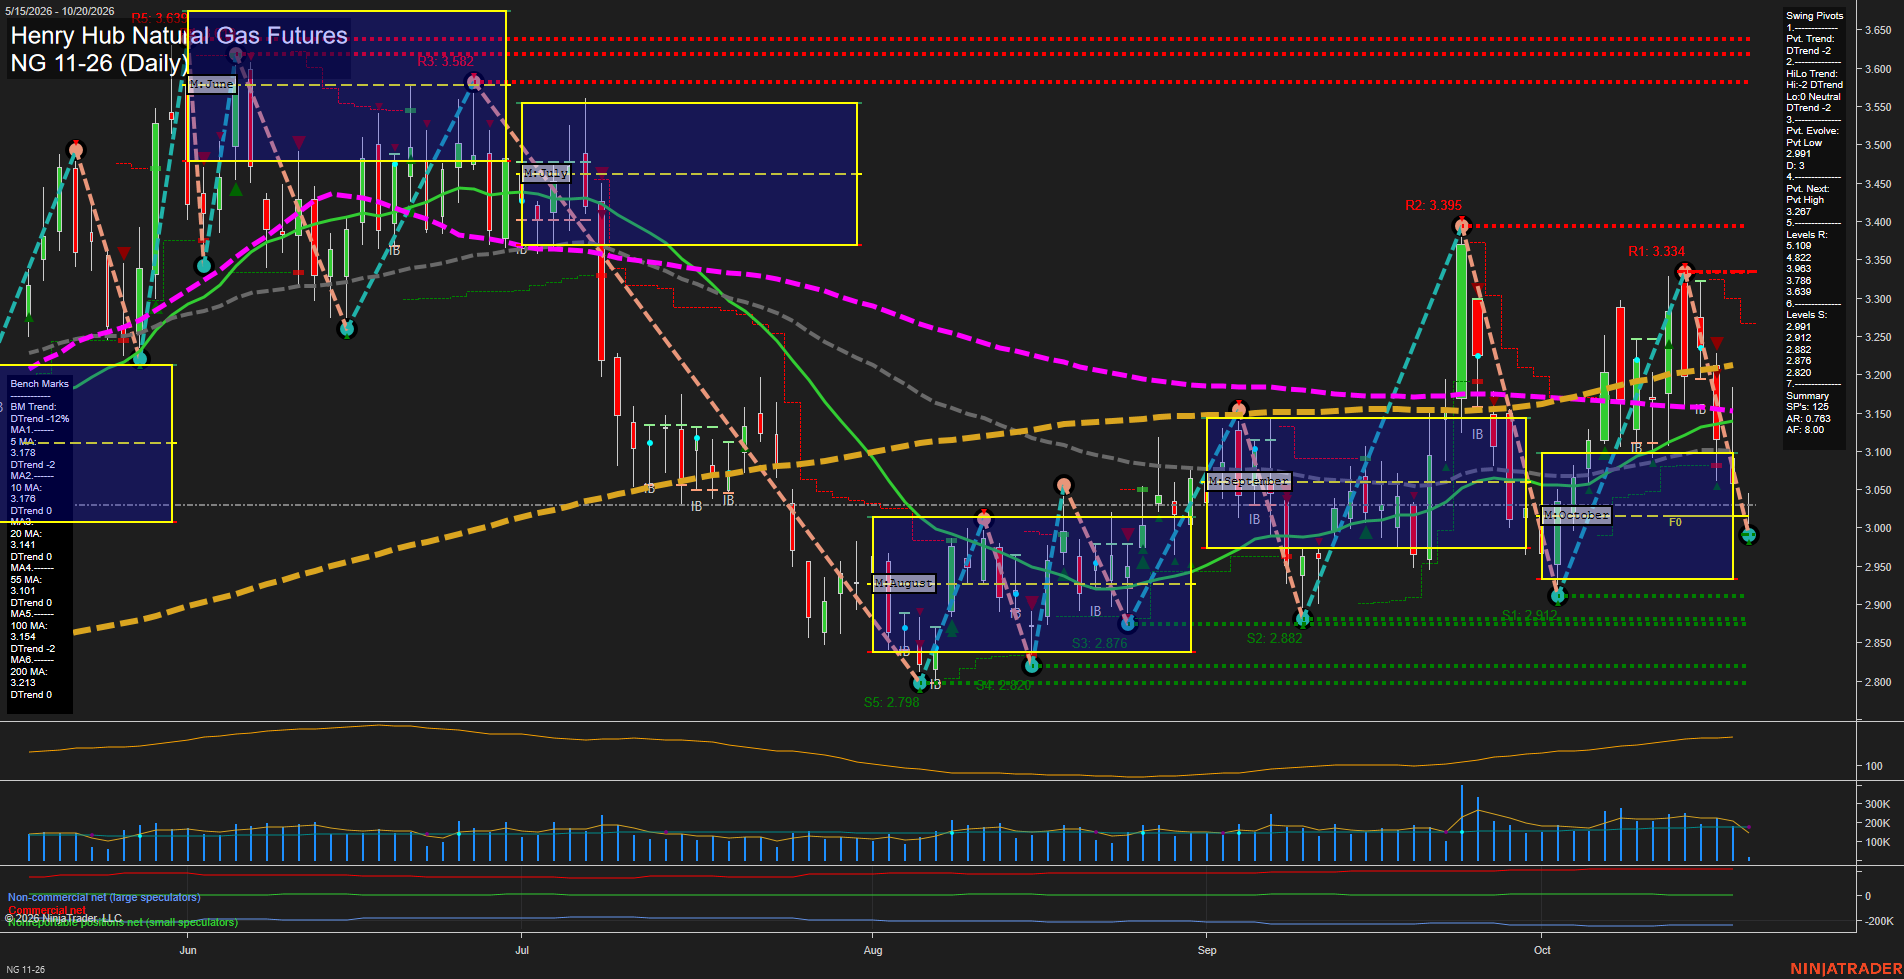
NG Henry Hub Natural Gas Futures Daily Chart Analysis: 2026-Oct-20 07:06 CT
Price Action
- Last: 2.991,
- Bars: Large,
- Mom: fast.
WSFG Weekly
- Short-Term
- WSFG Current: -22%
- F0%/NTZ' Bias: Price Below,
- WSFG Trend: Down.
MSFG Month Oct
- Intermediate-Term
- MSFG Current: 9%
- F0%/NTZ' Bias: Price Above,
- MSFG Trend: Up.
YSFG Year 2026
- Long-Term
- YSFG Current: 14%
- F0%/NTZ' Bias: Price Above,
- YSFG Trend: Up.
Swing Pivots
- (Short-Term) 1. Pvt. Trend: DTrend,
- (Intermediate-Term) 2. HiLo Trend: DTrend,
- 3. Pvt. Evolve: Pvt low 2.991,
- 4. Pvt. Next: Pvt high 3.267,
- 5. Levels R: 4.822, 3.963, 3.639,
- 6. Levels S: 2.991, 2.912, 2.882, 2.876, 2.820, 2.798.
Daily Benchmarks
- (Short-Term) 5 Day: 3.176 Down Trend,
- (Short-Term) 10 Day: 3.176 Down Trend,
- (Intermediate-Term) 20 Day: 3.140 Down Trend,
- (Intermediate-Term) 55 Day: 3.101 Down Trend,
- (Long-Term) 100 Day: 3.154 Down Trend,
- (Long-Term) 200 Day: 3.213 Down Trend.
Additional Metrics
Overall Rating
- Short-Term: Bearish,
- Intermediate-Term: Bearish,
- Long-Term: Bearish.
Key Insights Summary
Price action has shifted into a fast, large-range selloff from the recent 3.33 pivot high, returning to the 2.991 pivot-low area and below the weekly F0% level. The short-term pivot and intermediate HiLo structures are both in DTrend, while price is beneath every listed daily benchmark, confirming broad downside alignment. The monthly and yearly fib grids remain positive, framing the current decline as a countertrend retracement within a still-higher longer-term session structure. Nearby support clusters at 2.991 through 2.876 define the active lower range, while 3.267 and 3.334 are the closest upside swing-reference levels. Elevated ATR and the sharp reversal from the October rally reflect expanding volatility and a decisive loss of near-term momentum.
Chart Analysis ATS AI Generated: 2026-10-20 07:06 for Informational use only, not trading advice. Terms and Risk Disclosure Copyright © 2026. Algo Trading Systems LLC.